Boynton Beach Home Prices: $474K, Down 4.3% — 6 ZIPs (2026)
$474,046. That is what a typical Boynton Beach home is worth right now, and it is $21,435 less than a year ago. Prices here have slipped for 11 of the last 12 months.
Quick answer: The average home price in Boynton Beach, FL is $474,046 as of February 2026, down 4.3% year over year according to Zillow.
Current Home Prices in Boynton Beach
The median sits at $474,046. That is the midpoint across six ZIP codes inside city limits. The cheapest end of the market starts near $300,723. The priciest neighborhood clears $927,729.
| Metric | Value |
|---|---|
| Median home value | $474,046 |
| Year-over-year change | −4.3% |
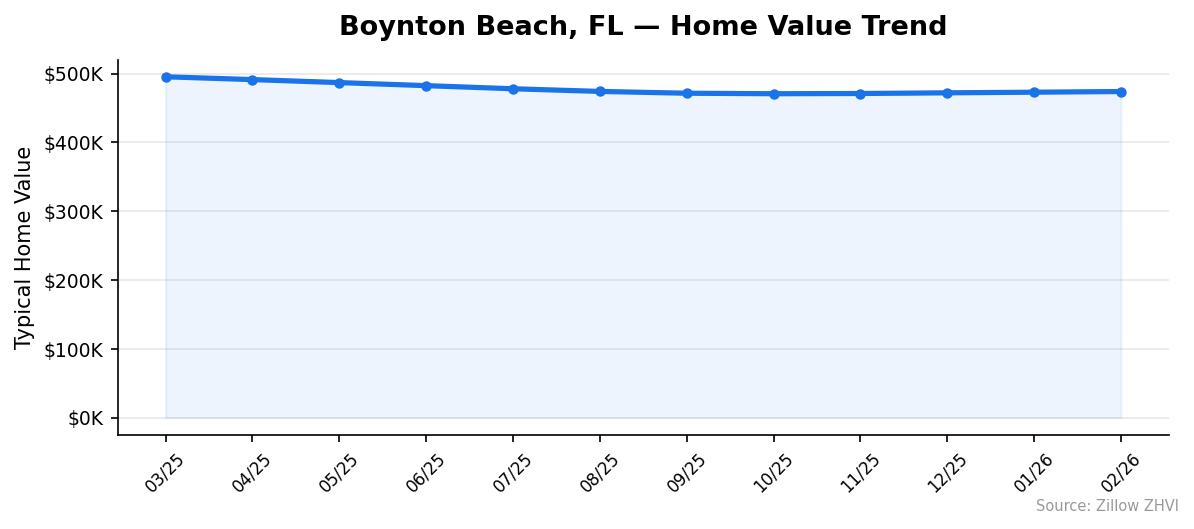
| 12-month peak (Mar 2025) | $495,481 |
| Low end of market | $300,723 |
| High end of market | $927,729 |
| ZIPs analyzed | 6 |
| Metro area | Miami-Fort Lauderdale-Pompano Beach |
The spread between the cheapest and most expensive ZIP is roughly $627,000. That is a wide gap for a city of 83,000 people. It tells you Boynton Beach is not one housing market — it is several. Waterfront and gated inland communities sit on one side. Older neighborhoods closer to the urban core sit on the other.
A 4.3% annual decline is real, but the monthly picture is stabilizing. Values dropped from $495K in March 2025 down to $470,856 in October, then ticked back up for four straight months. The floor may be in. Whether it holds is another question.
Boynton Beach Home Prices by Neighborhood
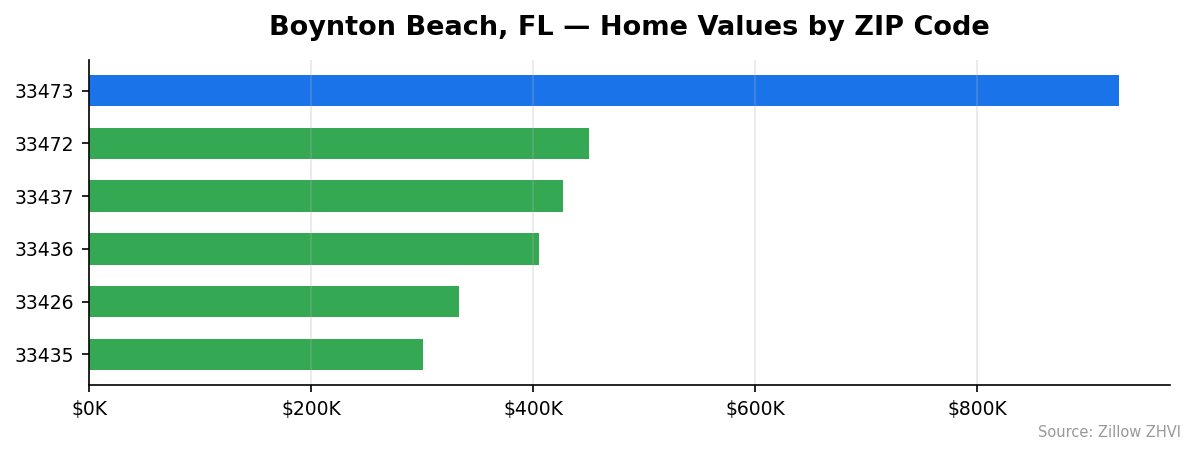
Six ZIP codes carry Boynton Beach’s housing data. One of them is five times the price of the cheapest.
| ZIP Code | Typical Home Value | Typical Rent |
|---|---|---|
| 33435 | $300,723 | $2,413 |
| 33426 | $333,114 | $2,348 |
| 33436 | $405,370 | $2,190 |
| 33437 | $426,597 | $2,609 |
| 33472 | $450,743 | $3,325 |
| 33473 | $927,729 | Data not available |
Most Expensive
33473 — $927,729. Nearly double the city median. Rent data is not available here, which often indicates a market dominated by owner-occupied single-family homes rather than rentals.
33472 — $450,743. Priced close to the city average, but rents here are the highest in the city at $3,325, a sign of strong landlord demand.
33437 — $426,597. Below the city median on price, above average on rent at $2,609. That rent-to-value ratio favors landlords.
Most Affordable
33435 — $300,723. The cheapest ZIP by a clear margin. Roughly 37% under the city median. Rents here still run $2,413, which gives this ZIP the strongest rent-to-price ratio in the city.
33426 — $333,114. The second-cheapest option. Typical rent of $2,348 keeps the monthly math workable for investors.
33436 — $405,370. A middle-tier ZIP with the lowest rent in the city at $2,190 per month.
Rent vs Buy in Boynton Beach
Rents across five Boynton Beach ZIPs range from $2,190 to $3,325 per month. Call it an average of roughly $2,577.
Now the buy side. On a $474,046 home with 20% down, the mortgage is $379,237. At a 7% rate over 30 years, principal and interest come to about $2,523 per month. Add Florida property taxes (roughly $500/month at this price point), homeowners insurance (which has climbed sharply in Florida — figure $300-$500/month), and HOA fees common to many South Florida communities. Monthly ownership cost lands near $3,600 to $3,900.
| Option | Typical Monthly Cost |
|---|---|
| Rent (city average) | ~$2,577 |
| Buy median home (with 20% down) | ~$3,600 – $3,900 |
Renting saves you roughly $1,000 to $1,300 per month. That is before you factor in maintenance, the down payment you keep in your pocket, and Florida’s insurance volatility.
The math favors renters right now. The only case for buying at these prices is if you plan to stay seven-plus years and expect long-term appreciation to offset the premium.
Population Growth and Migration
Boynton Beach added 2,621 residents between 2020 and 2024. That is a 3.3% gain over four years.
| Year | Population |
|---|---|
| 2020 | 80,474 |
| 2021 | 80,092 |
| 2022 | 81,351 |
| 2023 | 82,361 |
| 2024 | 83,095 |
Population dipped slightly in 2021, then grew each year after. The trajectory is clear — more people live here now than at any point in the data.
How does that compare to other Florida cities?
| City | 2024 Population | 4-Year Growth |
|---|---|---|
| Port St. Lucie | 258,575 | +25.0% |
| Cape Coral | 233,025 | +19.2% |
| Miami | 487,014 | +10.0% |
| Orlando | 334,854 | +8.8% |
| Tampa | 414,547 | +6.7% |
| Boynton Beach | 83,095 | +3.3% |
Boynton Beach is growing, but slower than the state’s breakout markets. Port St. Lucie, an hour north, is expanding eight times faster. Cape Coral isn’t far behind.
Slower population growth means slower demand pressure on housing. That is one reason Boynton Beach prices have cooled while Florida as a whole continued climbing in many pockets.
Boynton Beach Housing Market Trends
Here is the 12-month path of typical home values.
| Month | Typical Value |
|---|---|
| Mar 2025 | $495,481 |
| Apr 2025 | $491,407 |
| May 2025 | $487,039 |
| Jun 2025 | $482,604 |
| Jul 2025 | $478,067 |
| Aug 2025 | $474,210 |
| Sep 2025 | $471,575 |
| Oct 2025 | $470,856 |
| Nov 2025 | $471,178 |
| Dec 2025 | $472,159 |
| Jan 2026 | $473,086 |
| Feb 2026 | $474,046 |
Two distinct phases. From March through October 2025, values fell every single month — a $24,625 drop in seven months. Then November hit, and the line bent back upward. Four consecutive months of small gains followed.
The bounce is real but modest. February 2026 values are still $21,435 below March 2025. The market gave back 87% of what it lost over the prior year — but only 13% of it has returned.
Boynton Beach is no longer falling. It is not yet recovering at any meaningful pace either.
Is Boynton Beach a Good Place to Buy in 2026?
The data points to a buyer’s market — with caveats.
Prices are down 4.3% over the year. That is a concrete discount compared to the 2025 peak. Rent is roughly $1,000 per month cheaper than owning. That suggests buyers hold the upper hand in negotiations.
But the recent four-month uptick suggests sellers are less willing to slash prices than they were last fall. Population is growing, just slowly. Supply pressure could return if mortgage rates drop.
The case for buying: you want a specific property, you plan to hold at least five years, and you are comfortable with Florida’s insurance and property tax environment. The case for waiting: you have flexibility, want to see if the recent bounce holds, and prefer to rent for under $2,600 while watching the data.
Either decision is defensible. The mistake is paying 2025-peak prices in 2026.
Boynton Beach Housing Market Outlook for 2026-2027
The 3-month trend shows values rising about $960 per month on average since October 2025. If the current pace continues, Boynton Beach would recover its March 2025 peak by late 2027.
That is a big if. The 12-month picture is still negative. The recent gains are small enough that a single soft month could reverse them.
Watch three things through the summer. First, whether the monthly gains accelerate or fade. Second, whether new listings spike — Florida sellers often flood the market in April and May. Third, rent direction. If ZORI rents start falling, it means softening demand that will eventually hit sale prices too.
A flat to slightly positive six months is the base case. A return to declines is possible if rates stay elevated or insurance costs force more sellers out.
Similar Markets in FL
- Port Saint Lucie — An hour north, growing 7.5× faster than Boynton Beach.
- Pembroke Pines — Another Miami-metro suburb with comparable price points to consider.
- Fort Lauderdale — Higher-priced coastal market just south on I-95.
- Miami — The regional anchor, with a much larger and more expensive housing market.
- Homestead — South Miami-Dade alternative often cheaper than northern Palm Beach County.
Frequently Asked Questions
What is the average home price in Boynton Beach?
The average home price in Boynton Beach, FL is $474,046 as of February 2026. That is the Zillow Home Value Index reading across six ZIP codes. The cheapest ZIP (33435) runs $300,723; the priciest (33473) hits $927,729.
Are home prices going up or down in Boynton Beach?
Down 4.3% year over year. Values peaked at $495,481 in March 2025 and dropped steadily through October. The last four months show a small bounce, but the market is still roughly $21,000 below its 2025 high.
Is it cheaper to rent or buy in Boynton Beach?
Renting is cheaper. Typical rents range from $2,190 to $3,325 per month, averaging around $2,577. Owning the median $474K home with 20% down costs roughly $3,600 to $3,900 per month after taxes, insurance, and HOA — a $1,000+ monthly gap.
What is the most affordable neighborhood in Boynton Beach?
ZIP 33435 at $300,723. That is 37% below the city median. ZIP 33426 comes in second at $333,114. Both sit under the Palm Beach County average and offer some of the strongest rent-to-price ratios in the city.
Methodology
Home values are based on the Zillow Home Value Index (ZHVI), a smoothed measure of typical home values in the 35th to 65th percentile range. Rent estimates use the Zillow Observed Rent Index (ZORI). Population figures come from the U.S. Census Bureau Population Estimates Program (2020-2024 vintage). All datasets are publicly available. Housing data updated 2026-02-28.