Cape Coral Home Prices: $343K, Down 8.2% — 6 ZIPs Analyzed (2026)
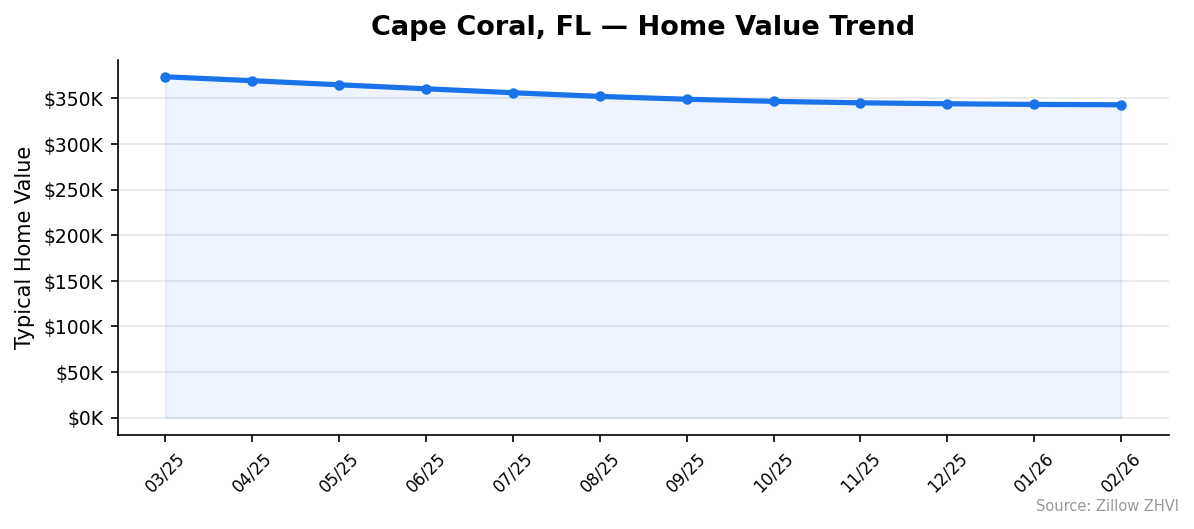
$343,064. That’s the typical Cape Coral home in February 2026, and it’s down 8.2% from a year ago. The drop has been steady, not sudden — prices have fallen every month for the past year.
Quick answer: The average home price in Cape Coral, FL is $343,064 as of February 2026, down 8.2% year over year according to Zillow.
Current Home Prices in Cape Coral
The headline number is $343,064. That’s the median across six ZIP codes in the city. A year ago the same measure stood at roughly $373,727. The gap is about $30,000.
| Metric | Value |
|---|---|
| Median home value | $343,064 |
| Year-over-year change | -8.2% |
| Cheapest ZIP | $295,095 (33909) |
| Most expensive ZIP | $417,211 (33914) |
| Price range across city | $122,116 |
| ZIP codes tracked | 6 |
| Data through | Feb 28, 2026 |
The spread between the cheapest and priciest ZIP is wide. A buyer crossing from 33909 to 33914 pays roughly 41% more for the typical home. That’s not a small step.
You’re looking at a market that has cooled. An 8.2% decline puts Cape Coral among the softer Florida metros tracked here. The drop has not stopped — the latest month-over-month read still shows prices slipping. February 2026 came in $377 below January.
This is the Cape Coral-Fort Myers metro, and the data here covers the city of Cape Coral specifically. The figures are typical home values, not list prices or sales prices. They sit in the 35th to 65th percentile of the housing stock.
For context, the city peaked in this dataset at $373,727 last March. It has lost about $30,663 of typical value since.
Cape Coral Home Prices by Neighborhood
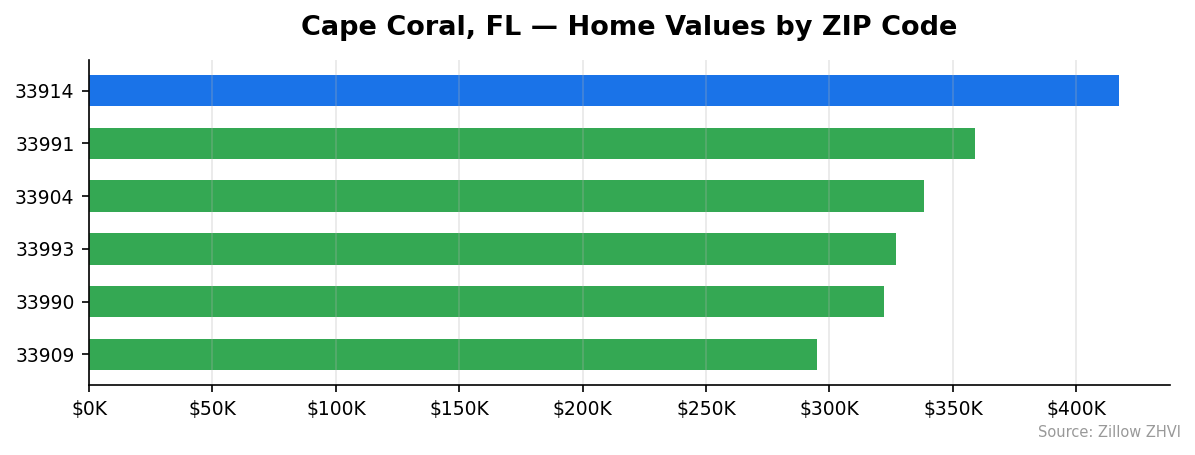
Six ZIP codes make up the city. Here’s what each one looks like.
| ZIP | Median Home Value | Typical Rent |
|---|---|---|
| 33909 | $295,095 | $1,896 |
| 33990 | $322,058 | $1,679 |
| 33993 | $327,043 | $2,123 |
| 33904 | $338,126 | $1,705 |
| 33991 | $358,852 | $1,802 |
| 33914 | $417,211 | $1,829 |
Most Expensive
33914 leads at $417,211 — about $74,000 above the city average and the only ZIP above $400K. Despite the price tag, typical rent here ($1,829) sits below 33993 and 33909, which suggests buyers, not renters, are setting the pace in this ZIP.
33991 comes in second at $358,852, roughly $16,000 above the city average. Rent of $1,802 is close to the city’s middle.
33904 sits third at $338,126, just below the city median. Rents are the second-lowest in the city at $1,705.
Most Affordable
33909 is the cheapest at $295,095, about $48,000 under the city average. It also has the second-highest typical rent at $1,896, which gives it the strongest rent-to-price ratio in town.
33990 comes next at $322,058 with the lowest rent in the city, $1,679.
33993 is third-cheapest at $327,043 but carries the highest rent of any ZIP — $2,123. That gap stands out: the typical home costs less than five of the six ZIPs, but the typical rent costs more than all of them.
Rent vs Buy in Cape Coral
Rents in Cape Coral run from $1,679 to $2,123 per month, depending on the ZIP. The citywide average across the six ZIPs comes to about $1,839 a month.
Now compare that to a purchase. A $343,064 home with 20% down ($68,613 cash up front) leaves a $274,451 mortgage. At a 7% rate over 30 years, principal and interest run about $1,826 a month. Add property taxes (Florida runs roughly 1.0% of value, or about $286 a month here) and homeowners insurance (Florida averages have been steep — figure $300 a month at minimum). That puts the all-in monthly carry near $2,400 before HOA or maintenance.
Renting at $1,839 saves roughly $560 a month over buying — and avoids the $68,613 down payment.
The math tilts toward renting today. Two things would change that: a price floor (so you stop catching a falling knife) and lower mortgage rates (so the carry comes down). Neither has happened yet.
ZIP 33993 is the one ZIP where rent ($2,123) actually approaches the cost of owning the median home there ($327,043). For most other ZIPs the rent gap is wider.
Population Growth and Migration
Cape Coral added 37,589 residents between 2020 and 2024. That’s a 19.2% gain in four years.
| Year | Population |
|---|---|
| 2020 | 195,436 |
| 2021 | 204,053 |
| 2022 | 218,013 |
| 2023 | 227,022 |
| 2024 | 233,025 |
The city grew every year. The biggest jump came in 2022, when population rose by nearly 14,000.
How does that compare to other Florida cities?
| City | 2024 Population | 4-Year Growth |
|---|---|---|
| Cape Coral | 233,025 | 19.2% |
| Port St. Lucie | 258,575 | 25.0% |
| Miami | 487,014 | 10.0% |
| Orlando | 334,854 | 8.8% |
| Tampa | 414,547 | 6.7% |
| Jacksonville | 1,009,833 | 6.1% |
Cape Coral is the second-fastest grower on this list, behind only Port St. Lucie. It’s growing roughly 2x faster than Miami and 3x faster than Jacksonville.
That’s the puzzle. Population is climbing, but home values are dropping. New residents have not been enough to absorb supply at last year’s prices. The most likely read: insurance costs, post-hurricane repair costs, and the elevated price base from the 2021-2022 run-up have priced out buyers faster than migration has replaced them.
Cape Coral Housing Market Trends
The trend is one direction: down.
| Month | Median Value |
|---|---|
| Mar 2025 | $373,727 |
| Apr 2025 | $369,442 |
| May 2025 | $364,941 |
| Jun 2025 | $360,573 |
| Jul 2025 | $356,228 |
| Aug 2025 | $352,222 |
| Sep 2025 | $349,105 |
| Oct 2025 | $346,800 |
| Nov 2025 | $345,200 |
| Dec 2025 | $344,131 |
| Jan 2026 | $343,441 |
| Feb 2026 | $343,064 |
Twelve straight months of decline. But look closer — the drops have shrunk.
From March to April: -$4,285. From January to February: -$377. The fall is decelerating. The most recent three months show losses of less than $1,100 each, after a spring and summer where the typical month shed $4,000 or more.
That’s not a recovery. It’s a slowdown in the rate of decline. The market is finding a floor, not bouncing off one.
The minimum and maximum ZIP values tell a similar story. The cheapest ZIP fell from $322,407 to $295,095 — a 8.5% drop. The priciest ZIP went from $452,587 to $417,211 — a 7.8% drop. The whole curve shifted down, roughly in parallel.
Is Cape Coral a Good Place to Buy in 2026?
This is a buyer’s market by the data. Prices have fallen for 12 straight months, the city is down 8.2% year over year, and rent is materially cheaper than buying.
But “buyer’s market” does not mean “bottom.” The trend has slowed, not reversed. A buyer who waits another quarter is likely to see prices flat or slightly lower — not higher. The cost of waiting is small.
Three things in favor of buying now: population is growing fast (19.2% over four years), the price decline is decelerating, and inventory should be its widest in years. Three things against: prices are still drifting down, Florida insurance costs are high, and the rent-vs-buy math currently favors renting by several hundred dollars a month.
If you plan to live in the home for 7+ years, the cycle will work itself out. If you’re buying for a 2-3 year horizon, the math is harder.
Cape Coral Housing Market Outlook for 2026-2027
The 3-month trend suggests prices are stabilizing. Drops shrunk from $1,069 (Nov to Dec) to $690 (Dec to Jan) to $377 (Jan to Feb). If that pace continues, Cape Coral could find a floor by mid-2026.
The annualized rate of the latest 3-month change (-0.6% over three months) works out to roughly -2.4% on an annual basis — far softer than the -8.2% YoY headline. The worst of the correction looks to be in the rearview mirror.
What could re-accelerate the decline: a hurricane, a spike in insurance premiums, or a Florida-wide migration reversal. What could end it: population growth catching up with the price reset, which the Census data already shows is in motion.
For now: expect a soft landing rather than a sharp rebound.
Similar Markets in FL
- Port Saint Lucie — the fastest-growing Florida city in this dataset (25%), and a useful comparison for buyers chasing migration trends.
- Tampa — a larger metro with slower population growth (6.7%) but more job-market depth.
- Jacksonville — Florida’s biggest city, with 6.1% growth and typically lower price points than Cape Coral.
- Orlando — central Florida alternative with 8.8% growth and a more diversified economy.
- Miami — a high-cost coastal benchmark; useful if you want to see how Cape Coral compares to the priciest end of the state.
Frequently Asked Questions
What is the average home price in Cape Coral?
The average home price in Cape Coral, FL is $343,064 as of February 2026. That figure spans six ZIP codes, with values ranging from $295,095 in 33909 to $417,211 in 33914.
Are home prices going up or down in Cape Coral?
Down. Prices have fallen 8.2% year over year and have dropped every single month for the past 12. The pace of decline has slowed though — recent monthly losses are under $1,100, compared to $4,000+ during last spring.
Is it cheaper to rent or buy in Cape Coral?
Renting wins on monthly cost. Typical rent across the city averages around $1,839, while owning the median home at $343,064 (with 20% down at 7% interest) runs near $2,400 a month once taxes and insurance are factored in. That’s a $560 monthly gap, plus the $68,613 down payment.
What is the most affordable neighborhood in Cape Coral?
ZIP 33909 at $295,095. It sits about $48,000 under the citywide median and also has one of the highest typical rents at $1,896, which gives it the strongest rent-to-price ratio in the city.
Methodology
Home values are based on the Zillow Home Value Index (ZHVI), a smoothed measure of typical home values in the 35th to 65th percentile range. Rent estimates use the Zillow Observed Rent Index (ZORI). Population figures come from the U.S. Census Bureau Population Estimates Program (2020-2024 vintage). All datasets are publicly available. Housing data updated 2026-02-28.