Wilkes-Barre Home Prices: $175K, Up 4.3% — 4 ZIPs Analyzed (2026)
$175,125. That’s the typical home price in Wilkes-Barre, PA as of February 2026. Values are up 4.3% from a year ago, and the market has climbed every month since last spring.
Quick answer: The average home price in Wilkes-Barre, PA is $175,125 as of February 2026, up 4.3% year over year according to Zillow.
Current Home Prices in Wilkes-Barre
The citywide average sits at $175,125. That’s well below the Pennsylvania average and a fraction of what buyers pay in Philadelphia or the Lehigh Valley.
| Metric | Value |
|---|---|
| Median home value | $175,125 |
| Year-over-year change | +4.3% |
| Lowest ZIP | $168,544 |
| Highest ZIP | $181,675 |
| Price spread | $13,131 |
| ZIP codes analyzed | 4 |
| Data as of | February 2026 |
The spread between the cheapest and priciest ZIP is just over $13,000. That’s tight. In most metros, the gap between the most expensive and most affordable neighborhoods runs into the hundreds of thousands. Wilkes-Barre is compact and the housing stock is priced within a narrow band.
A 4.3% annual gain outpaces inflation. For context, a buyer who purchased a median-priced home a year ago has seen roughly $7,200 in paper appreciation. That’s modest growth, not a speculative surge.
The metro area — Scranton–Wilkes-Barre — feeds into these numbers. This is northeast Pennsylvania, former coal country, now a logistics and warehousing corridor along I-81.
Wilkes-Barre Home Prices by Neighborhood
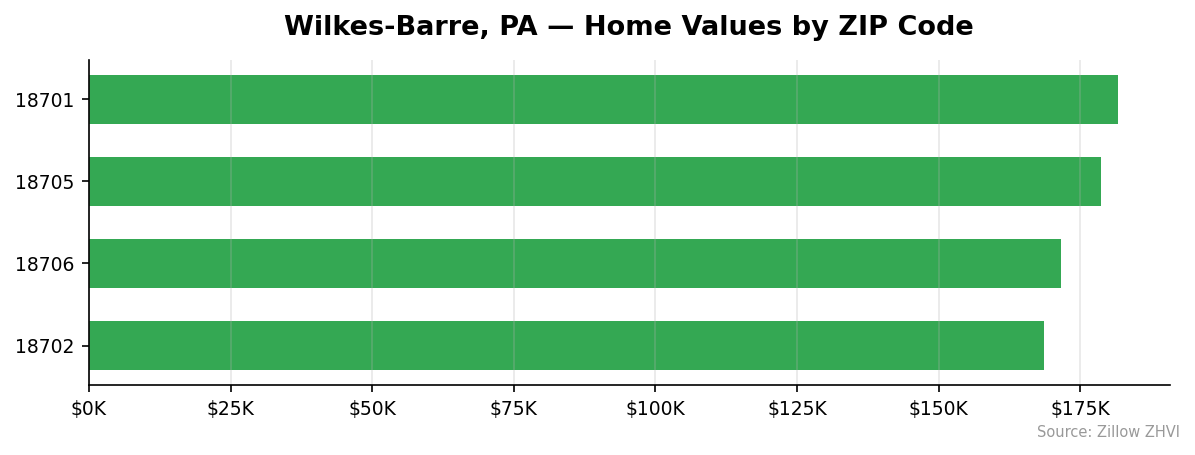
Four ZIP codes make up the city. Here’s how they stack up.
| ZIP Code | Median Home Value | vs City Avg |
|---|---|---|
| 18701 | $181,675 | +3.7% |
| 18705 | $178,699 | +2.0% |
| 18706 | $171,580 | -2.0% |
| 18702 | $168,544 | -3.8% |
Most Expensive
- 18701 — $181,675. This covers downtown and the immediate surrounding blocks, the priciest address in the city.
- 18705 — $178,699. Sits 2% above the city average and holds the second-highest values.
- 18706 — $171,580. Slightly below average but still above the floor, with a rent estimate of $1,238 per month.
Most Affordable
- 18702 — $168,544. The cheapest ZIP in the city, nearly 4% below the citywide median, with rent averaging $1,300.
- 18706 — $171,580. The second-most affordable option, rents available.
- 18705 — $178,699. Sits in the middle of the pack on the higher side.
If you’re shopping for the lowest entry point, 18702 is the target. It’s the only ZIP under $170K.
Rent vs Buy in Wilkes-Barre
Rent data is available for two ZIPs. The numbers:
| ZIP Code | Average Rent | Monthly |
|---|---|---|
| 18702 | $1,300 | per month |
| 18706 | $1,238 | per month |
Now the buy side. A $175,125 home with 20% down ($35,025) and a 30-year mortgage at current rates around 7% puts the principal and interest near $932 per month. Add property taxes (Luzerne County runs around 2% of assessed value, roughly $290/month on a $175K home) and insurance ($100/month), and the all-in monthly cost lands near $1,322.
That’s within a few dollars of the rent in 18702.
The math is close enough that the tiebreaker comes down to down payment cash and how long you plan to stay. Renting for $1,300 requires no $35K lump sum. Buying builds equity but ties up capital.
For a 5%-down buyer, the mortgage jumps higher once PMI is factored in. That tilts the math back toward renting in the short run.
Population Growth and Migration
Wilkes-Barre is growing — slowly.
| Year | Population |
|---|---|
| 2020 | 44,277 |
| 2021 | 44,346 |
| 2022 | 44,323 |
| 2023 | 44,424 |
| 2024 | 44,661 |
The city added 384 residents between 2020 and 2024. That’s 0.9% growth over four years, or roughly 0.2% per year.
Compare that to other Pennsylvania cities:
| City | 2024 Population | 4-Year Growth |
|---|---|---|
| Bethlehem | 79,453 | +4.9% |
| Pittsburgh | 307,668 | +1.6% |
| Allentown | 127,138 | +1.1% |
| Reading | 96,000 | +1.1% |
| Harrisburg | 50,649 | +1.1% |
| Wilkes-Barre | 44,661 | +0.9% |
Wilkes-Barre lags the state’s larger cities but is still on the growth side of the ledger. Bethlehem is the standout, pulling in new residents five times faster.
Slow population growth limits how fast home prices can rise. There’s no demand surge pushing prices up. The 4.3% appreciation is coming from something else — likely tight supply and affordability-driven demand from out-of-state buyers priced out of the New York and New Jersey metros.
Wilkes-Barre Housing Market Trends
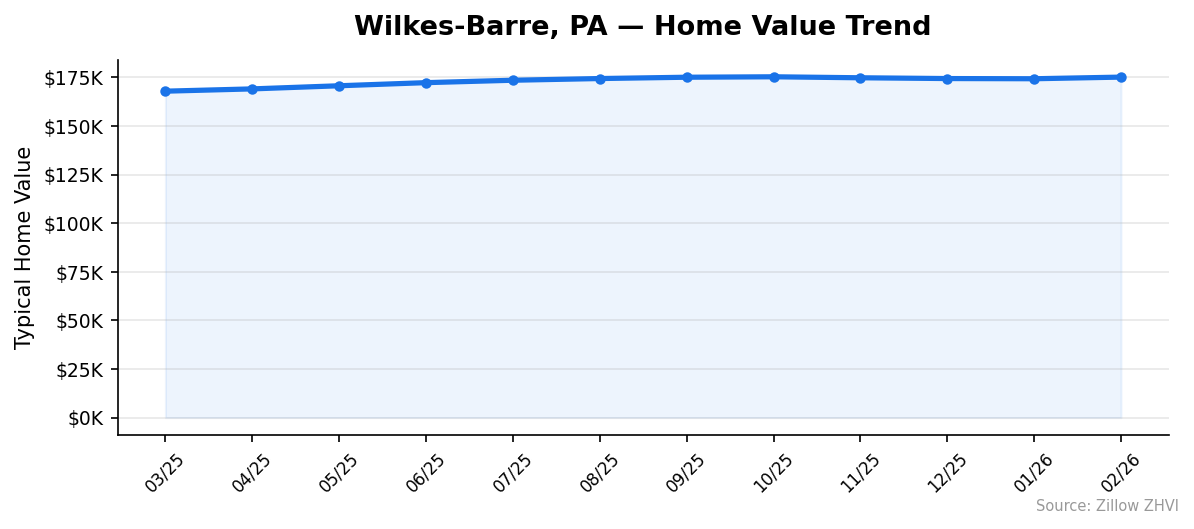
Twelve months of data shows a steady upward grind.
| Month | Median | Range |
|---|---|---|
| Feb 2026 | $175,125 | $168,544 – $181,675 |
| Jan 2026 | $174,282 | $167,999 – $180,345 |
| Dec 2025 | $174,382 | $168,579 – $180,259 |
| Nov 2025 | $174,781 | $169,542 – $179,885 |
| Oct 2025 | $175,289 | $170,587 – $179,835 |
| Sep 2025 | $175,062 | $170,915 – $180,403 |
| Aug 2025 | $174,386 | $170,739 – $179,952 |
| Jul 2025 | $173,514 | $170,260 – $178,890 |
| Jun 2025 | $172,276 | $169,103 – $177,399 |
| May 2025 | $170,673 | $167,214 – $175,947 |
| Apr 2025 | $169,064 | $165,184 – $174,594 |
| Mar 2025 | $167,892 | $163,501 – $173,468 |
Prices rose from $167,892 in March 2025 to $175,125 in February 2026. That’s a $7,233 gain across 11 months.
The path wasn’t perfectly linear. Values actually peaked at $175,289 in October 2025, dipped through November and December, then climbed back in the new year. That mild cooling was seasonal — every housing market loses a bit of momentum in late fall.
The February 2026 reading is essentially a new high, matching and edging past the October peak.
Is Wilkes-Barre a Good Place to Buy in 2026?
Price-to-population ratios favor buyers who need cash flow. At a $175K median, a household earning the U.S. median income can qualify for a home here without stretching — a rarity in 2026.
The 4.3% annual appreciation isn’t dramatic but it’s steady. Eleven consecutive months of mostly upward movement suggests a functioning market, not a bubble.
Supply appears to be constrained enough to keep pulling prices up despite slow population growth. That’s a seller-leaning market, but only mildly. Buyers aren’t getting priced out — they’re just not getting bargains.
For investors, the rent-to-price ratio is around 0.9% monthly (using ZIP 18702’s $1,300 rent against its $168,544 value). That’s above the 0.7% threshold many landlords target, making Wilkes-Barre workable for cash-flow rentals.
Primary buyers get the best deal here. Investors get a decent deal. Speculators looking for fast appreciation should look elsewhere.
Wilkes-Barre Housing Market Outlook for 2026-2027
The 3-month trend (December through February) shows prices rising from $174,382 to $175,125 — a gain of $743, or 0.4%. The 12-month trend is $7,233, or 4.3%.
If the current pace continues, Wilkes-Barre could cross $180,000 sometime in the second half of 2026. The recent monthly gains are smaller than what the city posted in spring 2025, which suggests the pace of appreciation is cooling.
The 3-month trend is clearly positive but decelerating. Seasonal patterns in this data (fall softness, spring strength) are likely to repeat. Watch the spring 2026 numbers — if they don’t show the same acceleration the city saw in April-June 2025, the 4.3% annual gain will compress.
Slow population growth puts a ceiling on how fast prices can rise long term.
Similar Markets in PA
- Scranton — not listed, but the twin-city neighbor with similar price levels.
- Harrisburg — state capital with similar small-city dynamics and comparable population size.
- Reading — another smaller Pennsylvania market with affordable entry points for buyers priced out of Philadelphia.
- Allentown — Lehigh Valley option with faster population growth than Wilkes-Barre.
- Lancaster — for buyers willing to spend more in exchange for stronger long-term demand.
- York — a south-central PA alternative with a similar affordability profile.
Frequently Asked Questions
What is the average home price in Wilkes-Barre?
The average home price in Wilkes-Barre, PA is $175,125 as of February 2026. That figure is the Zillow Home Value Index across the city’s four ZIP codes, with individual neighborhoods ranging from $168,544 to $181,675.
Are home prices going up or down in Wilkes-Barre?
Home prices in Wilkes-Barre are up 4.3% year over year. The city has posted 11 straight months of gains since March 2025, when the median was $167,892. Monthly gains have been slowing since late fall 2025.
Is it cheaper to rent or buy in Wilkes-Barre?
Average rent in ZIP 18702 is about $1,300 per month. A mortgage on a median-priced $175,125 home — assuming 20% down, current rates, plus taxes and insurance — runs around $1,322. The two are nearly identical, so the decision turns on down payment cash and how long you plan to stay.
What is the most affordable neighborhood in Wilkes-Barre?
ZIP 18702 is the most affordable at $168,544. It sits about 3.8% below the citywide average and is the only ZIP in the city below $170,000. Rent here averages $1,300 per month.
Methodology
Home values are based on the Zillow Home Value Index (ZHVI), a smoothed measure of typical home values in the 35th to 65th percentile range. Rent estimates use the Zillow Observed Rent Index (ZORI). Population figures come from the U.S. Census Bureau Population Estimates Program (2020-2024 vintage). All datasets are publicly available. Housing data updated 2026-02-28.