Pittsburgh Home Prices: $260K, Down 0.1% — 35 ZIPs Analyzed (2026)
$259,898. That’s the typical Pittsburgh home in February 2026, and the number has barely moved in a year. Prices are down 0.1% from twelve months ago — a rounding error in any other market, but in Pittsburgh it fits the pattern: stability over swings.
Quick answer: The average home price in Pittsburgh, PA is $259,898 as of February 2026, down 0.1% year over year according to Zillow.
Current Home Prices in Pittsburgh
Pittsburgh remains one of the few metros where $260,000 still buys a real house. The median value sits at $259,898. Over the past 12 months, prices slipped 0.1% — less movement than the margin of error on most indexes.
The spread across the city is wide. The cheapest ZIP clocks in at $119,771. The most expensive runs to $555,647. That’s a 4.6x gap between the lowest and highest neighborhoods — larger than you’d expect for a city this size.
| Metric | Value |
|---|---|
| Median home value | $259,898 |
| Year-over-year change | -0.1% |
| Lowest ZIP value | $119,771 |
| Highest ZIP value | $555,647 |
| ZIP codes analyzed | 35 |
| Data as of | February 2026 |
What this means for you: Pittsburgh isn’t a market where timing matters much. Buying today versus buying a year ago produces almost the same bill. Sellers aren’t losing money, but they aren’t getting bidding wars either. The city has been flat long enough that flat should probably be treated as the baseline, not a pause before something else.
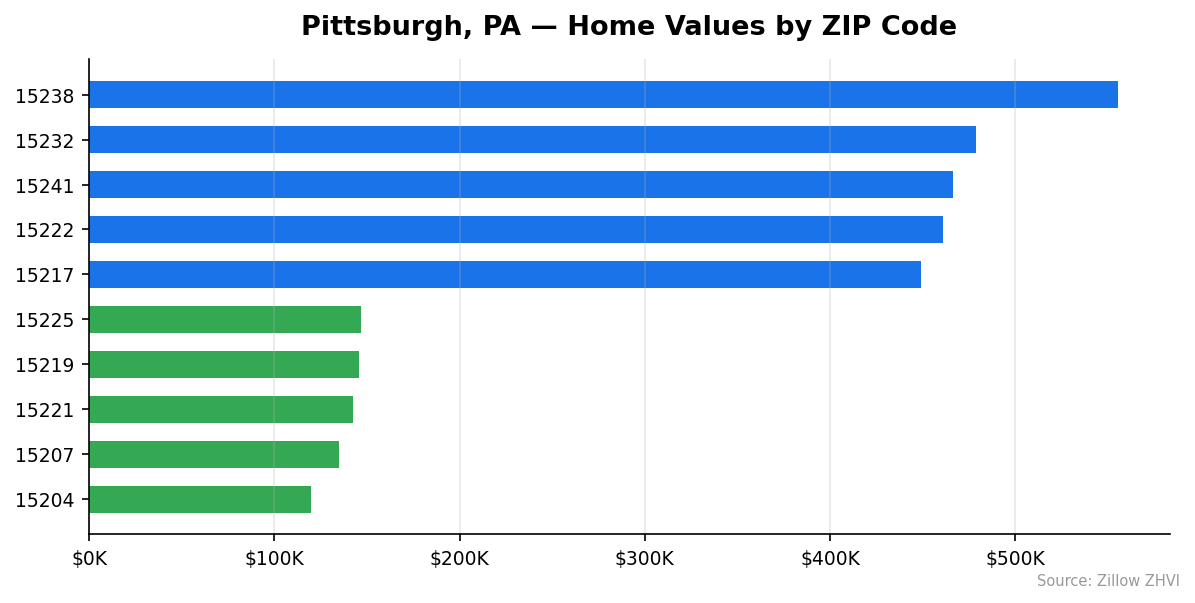
Pittsburgh Home Prices by Neighborhood
Pittsburgh’s ZIP codes vary more than the citywide median suggests. The Fox Chapel area (15238) tops the list at $555,647. Crafton Heights (15204) sits at the bottom at $119,771. Most neighborhoods cluster between $150,000 and $300,000.
| ZIP | Median Home Value | Median Rent |
|---|---|---|
| 15238 | $555,647 | $1,730 |
| 15232 | $478,550 | $1,580 |
| 15241 | $466,460 | $1,560 |
| 15222 | $460,802 | $2,013 |
| 15217 | $448,857 | $1,648 |
| 15228 | $400,510 | $1,210 |
| 15237 | $346,893 | $1,674 |
| 15215 | $333,185 | $1,498 |
| 15243 | $325,286 | n/a |
| 15201 | $289,564 | $1,984 |
| 15206 | $273,974 | $1,600 |
| 15224 | $259,245 | $1,438 |
| 15213 | $257,253 | $1,721 |
| 15236 | $243,591 | $1,213 |
| 15239 | $243,088 | n/a |
| 15229 | $238,838 | $1,481 |
| 15233 | $232,267 | $1,465 |
| 15220 | $229,541 | $1,406 |
| 15209 | $226,003 | $1,214 |
| 15203 | $219,441 | $1,630 |
| 15202 | $214,307 | $1,122 |
| 15211 | $209,885 | $1,488 |
| 15216 | $206,860 | $1,324 |
| 15234 | $204,863 | $1,496 |
| 15218 | $203,801 | $1,178 |
| 15226 | $193,049 | $1,429 |
| 15212 | $165,350 | $1,413 |
| 15235 | $165,333 | $1,329 |
| 15214 | $163,907 | $1,289 |
| 15208 | $150,166 | $1,395 |
| 15225 | $146,824 | n/a |
| 15219 | $145,755 | $1,726 |
| 15221 | $142,563 | $1,205 |
| 15207 | $135,007 | $1,324 |
| 15204 | $119,771 | $1,280 |
Most Expensive
- 15238 — $555,647. More than double the city median. Rents run $1,730.
- 15232 — $478,550. Shadyside-area ZIP with values 84% above the Pittsburgh median and moderate rent near $1,580.
- 15241 — $466,460. Upper St. Clair area. Homes sell for nearly 80% above the city average.
Most Affordable
- 15204 — $119,771. The cheapest ZIP in the city — about 46% of the median. Rent averages $1,280.
- 15207 — $135,007. Hazelwood / Glen Hazel. Values run roughly half the citywide median.
- 15221 — $142,563. Low home prices paired with one of the lower rent figures at $1,205.
Rent vs Buy in Pittsburgh
Rents across Pittsburgh’s 32 ZIP codes with available data average about $1,450 per month. The downtown core (15222) is the priciest at $2,013. Bellevue (15202) is the cheapest at $1,122.
Here’s the math on buying at the median. A $259,898 home with 20% down leaves a loan of $207,918. At today’s 30-year rates near 7%, principal and interest run about $1,383. Add property taxes in Allegheny County (roughly $250 a month at this price point) and insurance around $100. That’s roughly $1,733 monthly before any repair costs.
Against a $1,450 rent, buying costs about $280 more per month — and that’s before the down payment ties up $52,000 in cash.
| Cost | Monthly |
|---|---|
| Median rent | ~$1,450 |
| Median mortgage + tax + insurance | ~$1,733 |
| Difference | ~$283 in favor of renting |
The short-run math favors renting. The long-run math depends on whether you’d hold the house at least 5 to 7 years, since flat price appreciation means you’re relying on principal paydown, not market gains, to build equity. In a market moving 0.1% a year, patience isn’t optional — it’s the whole plan.
Population Growth and Migration
Pittsburgh is growing, slowly. The city added 4,870 residents from 2020 to 2024, a 1.6% gain.
| Year | Population |
|---|---|
| 2020 | 302,798 |
| 2021 | 305,427 |
| 2022 | 303,057 |
| 2023 | 304,766 |
| 2024 | 307,668 |
The trend isn’t a straight line. Population dipped in 2022 before recovering. By 2024 Pittsburgh had not just recovered but pushed past its 2020 baseline.
Against other Pennsylvania cities:
| City | 2024 Population | 4-Year Growth |
|---|---|---|
| Pittsburgh | 307,668 | 1.6% |
| Bethlehem | 79,453 | 4.9% |
| Allentown | 127,138 | 1.1% |
| Reading | 96,000 | 1.1% |
| Harrisburg | 50,649 | 1.1% |
| Lancaster | 58,441 | 0.9% |
Pittsburgh is outpacing most peer cities in the state. Only Bethlehem grew faster in percentage terms. For housing, that’s a supportive signal: the buyer pool isn’t shrinking. Rising population with flat prices usually means supply is keeping pace with demand, not that demand is collapsing.
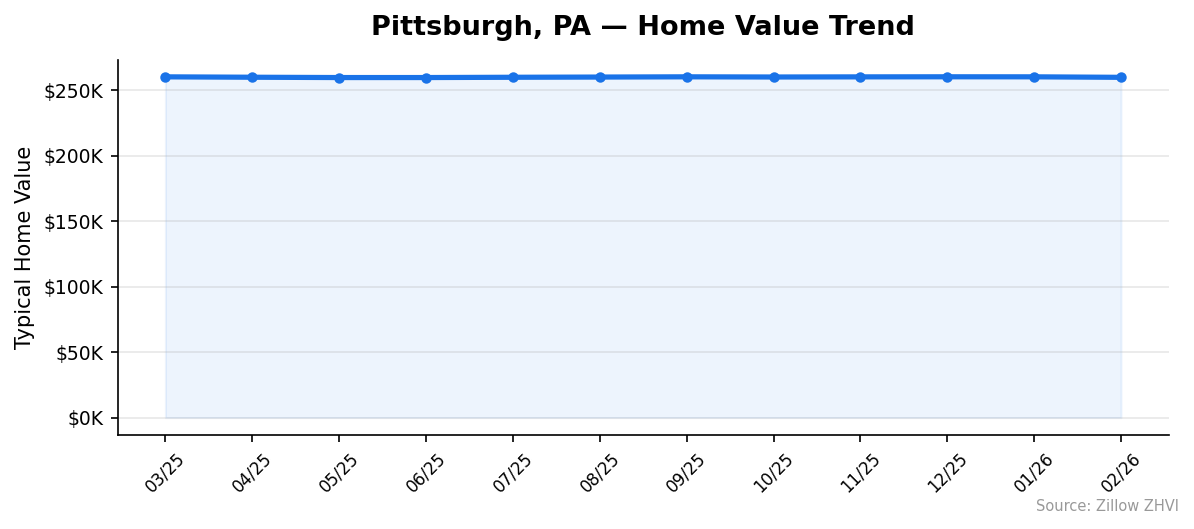
Pittsburgh Housing Market Trends
Twelve months of data show what “flat” actually looks like.
| Month | Median Value |
|---|---|
| Mar 2025 | $260,265 |
| Apr 2025 | $259,969 |
| May 2025 | $259,730 |
| Jun 2025 | $259,733 |
| Jul 2025 | $259,942 |
| Aug 2025 | $260,104 |
| Sep 2025 | $260,285 |
| Oct 2025 | $260,145 |
| Nov 2025 | $260,246 |
| Dec 2025 | $260,309 |
| Jan 2026 | $260,278 |
| Feb 2026 | $259,898 |
The high-to-low range across 12 months was $579 — less than a quarter of one percent. The top end of the market (the 15238 max) rose from $532,608 in March 2025 to $555,647 in February 2026, a 4.3% gain. The bottom of the market (the cheapest ZIP value) fell from $123,242 to $119,771, a 2.8% decline.
Translation: high-end Pittsburgh homes gained a little value. Low-end Pittsburgh homes lost a little. The middle didn’t budge.
Is Pittsburgh a Good Place to Buy in 2026?
For a buyer who wants to build equity through market appreciation, Pittsburgh is not it. The market has moved 0.1% in a year. There’s no wave to ride.
For a buyer who wants a house at a price that exists in fewer than 20 US cities, Pittsburgh is exactly it. You can still buy a median home for $260,000, and there are 9 ZIP codes with medians under $200,000.
The balance tips toward buyer-friendly. Prices aren’t rising fast enough to punish patience. Population growth is real but modest, which limits bidding pressure. Rents are cheap enough that there’s no “rent is throwing money away” argument at current mortgage rates — the monthly math actually favors renting by about $283.
If you plan to stay at least 5 to 7 years, buying makes sense. Principal paydown builds equity even when the market doesn’t. If you might move in 3 years, rent. The transaction costs alone (roughly 8-10% of sale price between commissions, taxes, and closing) would likely exceed any appreciation.
Pittsburgh Housing Market Outlook for 2026-2027
The 3-month trend shows a mild softening. Values moved from $260,309 in December to $259,898 in February — down $411, or 0.16%. That’s not a trend, but it’s the first time in months the direction has been consistently negative.
If the current pace continues, Pittsburgh finishes 2026 near where it started: within 1% of $260,000. The split between expensive and affordable ZIPs looks likely to widen, since high-end values gained 4.3% over the past year while low-end values fell 2.8%. That gap doesn’t usually close quickly.
A 3-to-6 month forecast based on momentum: flat to slightly down. Nothing in the data suggests a fast move in either direction. The market is boring, and in housing, boring markets tend to stay boring until something external — rates, jobs, migration — kicks them.
Similar Markets in PA
- Philadelphia — The state’s largest housing market, with prices and neighborhood variance on a larger scale than Pittsburgh.
- Allentown — Similar mid-size market in eastern PA with comparable population growth (1.1%).
- Harrisburg — State capital with a smaller population (50,649) and similar low-cost housing profile.
- Lancaster — Smaller PA city worth comparing if you’re looking outside the Pittsburgh metro for similar price points.
- Reading — Another mid-size PA market with flat growth and affordable pricing.
Frequently Asked Questions
What is the average home price in Pittsburgh?
The average home price in Pittsburgh, PA is $259,898 as of February 2026. That figure reflects the Zillow Home Value Index across 35 Pittsburgh ZIP codes, covering homes in the 35th to 65th percentile of typical market value.
Are home prices going up or down in Pittsburgh?
Prices are down 0.1% year over year — essentially flat. Over the full 12-month window, Pittsburgh’s median moved less than $600, making it one of the calmer markets in the country.
Is it cheaper to rent or buy in Pittsburgh?
Renting is cheaper monthly by about $283. A typical rent of $1,450 compares to a roughly $1,733 monthly carrying cost for a median-priced home at current mortgage rates, before factoring in the $52,000 down payment.
What is the most affordable neighborhood in Pittsburgh?
ZIP 15204, covering Crafton Heights and nearby western neighborhoods, has the lowest median value at $119,771 — about 46% of the citywide median. Rent in that ZIP averages $1,280.
Methodology
Home values are based on the Zillow Home Value Index (ZHVI), a smoothed measure of typical home values in the 35th to 65th percentile range. Rent estimates use the Zillow Observed Rent Index (ZORI). Population figures come from the U.S. Census Bureau Population Estimates Program (2020-2024 vintage). All datasets are publicly available. Housing data updated 2026-02-28.