Chambersburg Home Prices: $279K, Up 3.1% — 3 ZIPs Analyzed (2026)
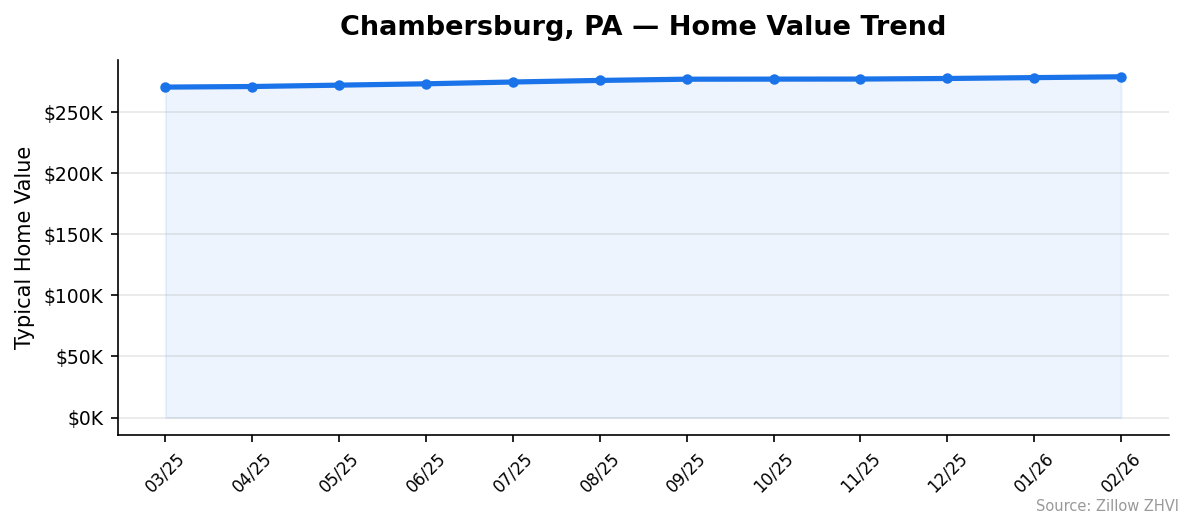
$278,763. That’s what a typical home costs in Chambersburg, Pennsylvania, as of February 2026. Prices are up 3.1% over the past year — and they’ve moved up every single month since March 2025.
Quick answer: The average home price in Chambersburg, PA is $278,763 as of February 2026, up 3.1% year over year.
Current Home Prices in Chambersburg
The median sits at $278,763. A year ago it was closer to $270,000. The gap between the cheapest and priciest ZIP in the city is roughly $61,000.
| Metric | Value |
|---|---|
| Median home value | $278,763 |
| Year-over-year change | +3.1% |
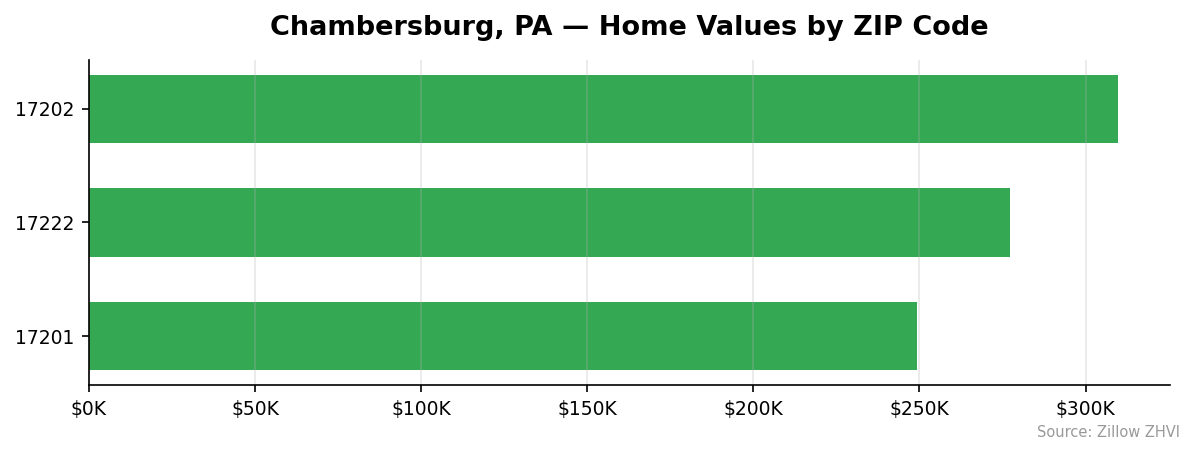
| Cheapest ZIP | $249,155 (17201) |
| Most expensive ZIP | $309,915 (17202) |
| ZIPs covered | 3 |
| Data through | February 2026 |
The Chambersburg-Waynesboro metro is small. Just three ZIP codes carry enough sales activity to produce a reliable typical-value figure. That keeps the spread between high and low manageable — about 24% from cheapest to priciest.
For context, $279K is well below the U.S. median, which sits north of $360K. You get more square footage in Chambersburg than you would in Lancaster or York, and dramatically more than in most of Philadelphia or Pittsburgh.
The price trend is steady, not explosive. Monthly gains have averaged about $700 to $1,200 over the past quarter. There is no sign of a price drop — every month in the past year posted an increase.
Buyers shopping today should expect homes priced near the median to move quickly. With YoY appreciation outpacing wage growth in much of Pennsylvania, the math favors people who already own.
Chambersburg Home Prices by Neighborhood
Three ZIPs split the city. One is clearly the budget tier, one sits at the top, and one tracks the city average.
| ZIP | Median Value | vs City Avg | Median Rent |
|---|---|---|---|
| 17202 | $309,915 | +11.2% | $1,263 |
| 17222 | $277,219 | -0.6% | Not available |
| 17201 | $249,155 | -10.6% | $1,191 |
Most Expensive
ZIP 17202 tops the list at $309,915, about 11% above the city median. Rent here runs $1,263 per month — the highest of the two ZIPs with rent data, though only $72 above the cheapest ZIP.
Mid-Range
ZIP 17222 sits almost exactly at the city median at $277,219. No rent data is reported for this ZIP, so renters have less visibility into pricing here.
Most Affordable
ZIP 17201 is the budget pick at $249,155 — roughly $30,000 below the city average and $61,000 below the priciest ZIP. Rent is $1,191 per month, only $72 cheaper than 17202 despite homes costing about $61K less. That ratio favors buying for anyone planning to stay long term.
The price gap between the cheapest and most expensive ZIP is wider than the rent gap suggests. That’s a clue that 17201 may be where first-time buyers find the best deals on a price-per-square-foot basis.
Rent vs Buy in Chambersburg
Renting wins on monthly cash flow. Buying wins on long-term cost.
The two ZIPs with rent data — 17201 and 17202 — average about $1,227 per month. Rent in 17222 isn’t tracked.
A typical mortgage on the median $278,763 home looks like this. With 20% down ($55,753) and a 30-year fixed loan at roughly 6.5%, the principal-and-interest payment is around $1,410. Add property taxes (Pennsylvania averages about $250 per month for a home this size) and homeowners insurance ($90), and the all-in monthly cost lands near $1,750.
| Cost | Rent (avg of 17201 + 17202) | Buy (median home, 20% down) |
|---|---|---|
| Monthly outlay | $1,227 | ~$1,750 |
| Up-front cash | First and last month | $55,753 + closing |
| Building equity | No | Yes |
Renting saves you about $520 per month and avoids the down payment. But part of that $1,410 mortgage payment is principal — money that comes back when you sell. Renters get nothing back.
If you plan to stay at least 5 years and prices keep rising at the current 3% pace, buying tends to come out ahead. For shorter stays, renting is the safer bet.
Chambersburg Housing Market Trends
Twelve straight months of gains. That’s the headline.
| Month | Median Value | Monthly Change |
|---|---|---|
| Feb 2026 | $278,763 | +$672 |
| Jan 2026 | $278,091 | +$721 |
| Dec 2025 | $277,370 | +$448 |
| Nov 2025 | $276,922 | +$65 |
| Oct 2025 | $276,857 | +$68 |
| Sep 2025 | $276,789 | +$994 |
| Aug 2025 | $275,795 | +$1,296 |
| Jul 2025 | $274,499 | +$1,466 |
| Jun 2025 | $273,033 | +$1,104 |
| May 2025 | $271,929 | +$1,116 |
| Apr 2025 | $270,813 | +$477 |
| Mar 2025 | $270,336 | — |
The pace cooled in October and November before picking back up into 2026. Summer 2025 saw the strongest monthly gains, with July adding nearly $1,500. Winter months posted smaller increases, which is normal — buying activity dips when weather turns.
Total appreciation from March 2025 to February 2026 is $8,427, or 3.1%. That tracks closely with broader U.S. home price growth over the same period.
There is no month in the past year where prices fell. That’s unusual in markets that saw big runups during 2020-2022 — many of those have since cooled or corrected. Chambersburg never overshot, so it has nothing to give back.
Is Chambersburg a Good Place to Buy in 2026?
The data points to a stable seller’s market. Twelve months of steady gains, no price corrections, and a median well below the U.S. average.
For buyers, the case is straightforward. Prices keep ticking up by less than $1,000 per month. That gives you breathing room to shop without panic. ZIP 17201 in particular looks attractive — sub-$250K homes are increasingly rare in the Northeast.
For sellers, you are not in a frenzy market. Homes will sell, but multi-offer bidding wars are unlikely outside of the lowest price tier. Pricing realistically matters more than chasing aggressive comps.
Investors should look at the rent-to-price ratio. ZIP 17201 offers $1,191 rent on a $249,155 home — a 5.7% gross yield. That’s modest but not bad for a small Pennsylvania metro.
Chambersburg Housing Market Outlook for 2026-2027
The 3-month trend points to continued slow gains. From December 2025 to February 2026, prices rose $1,393, or about 0.5%. Annualized, that pace would put the median near $285,000 by year-end 2026.
If the current pace continues, expect the median to cross $280K within the next quarter. The 12-month YoY rate of 3.1% has held remarkably steady — the rolling YoY barely moved between January and February, signaling that growth has not accelerated or decelerated.
A pause would not be surprising if mortgage rates spike or local supply jumps. But there is nothing in the trend data that flags either as imminent.
Similar Markets in PA
Chambersburg sits at the affordable end of Pennsylvania’s housing market. If you want to compare:
- Lancaster — a larger market with stronger urban pull and higher prices.
- York — another south-central PA city often compared to Chambersburg on price.
- Allentown — a Lehigh Valley alternative with bigger job-market access.
- Pittsburgh — the cheapest of PA’s major metros for buyers who want a city feel.
- Philadelphia — the state’s biggest market, with prices and pace far above Chambersburg.
Frequently Asked Questions
What is the average home price in Chambersburg?
The typical Chambersburg, PA home is worth $278,763 as of February 2026. That figure averages the city’s three tracked ZIP codes, which range from $249,155 in 17201 to $309,915 in 17202.
Are home prices going up or down in Chambersburg?
Prices are up 3.1% year over year. They have risen every month for the past 12 months, with monthly gains averaging $700 to $1,500. There is no signal of a downturn in the recent data.
Is it cheaper to rent or buy in Chambersburg?
Renting is cheaper month to month. Average rent across the two tracked ZIPs is about $1,227, while a typical mortgage with 20% down on the median home runs closer to $1,750 once taxes and insurance are included. Buying makes more sense if you plan to stay at least five years.
What is the most affordable neighborhood in Chambersburg?
ZIP 17201 is the cheapest area at $249,155, roughly $30,000 below the city average. Rent there runs $1,191 per month, making it the most accessible ZIP for both buyers and renters.
Methodology
Home values are based on the Zillow Home Value Index (ZHVI), a smoothed measure of typical home values in the 35th to 65th percentile range. Rent estimates use the Zillow Observed Rent Index (ZORI). Population figures come from the U.S. Census Bureau Population Estimates Program (2020-2024 vintage). All datasets are publicly available. Housing data updated 2026-02-28.