Phoenixville Home Prices: $574K, Up 1.6% — 3 ZIPs Analyzed (2026)
$574,286. That’s the typical home value in Phoenixville right now, according to the Zillow Home Value Index for February 2026. Prices are up 1.6% from a year ago — modest, but the climb has been steady every single month since last spring.
Quick answer: The average home price in Phoenixville, PA is $574,286 as of February 2026, up 1.6% year over year according to Zillow.
Current Home Prices in Phoenixville
The borough sits squarely in the upper bracket of the Philadelphia-Camden-Wilmington metro. At $574K, a Phoenixville home runs well above the national typical value and reflects the pull of Chester County’s job market and school districts.
Here’s the snapshot.
| Metric | Value |
|---|---|
| Median home value | $574,286 |
| Year-over-year change | +1.6% |
| Cheapest ZIP | $447,444 |
| Most expensive ZIP | $771,391 |
| ZIP codes analyzed | 3 |
| Data through | February 2026 |
The spread between the cheapest and most expensive ZIPs is $323,947. That’s a 72% gap from the bottom to the top — a wider range than you’d find in most boroughs this size, and a clue that the Phoenixville housing market isn’t one market but three distinct ones.
A 1.6% annual gain is mild. It’s not a boom. It’s also not a slide. For context, the typical Phoenixville home appreciated by about $9,000 over the last 12 months. Owners aren’t getting rich on equity, but they aren’t losing ground either.
Phoenixville Home Prices by Neighborhood
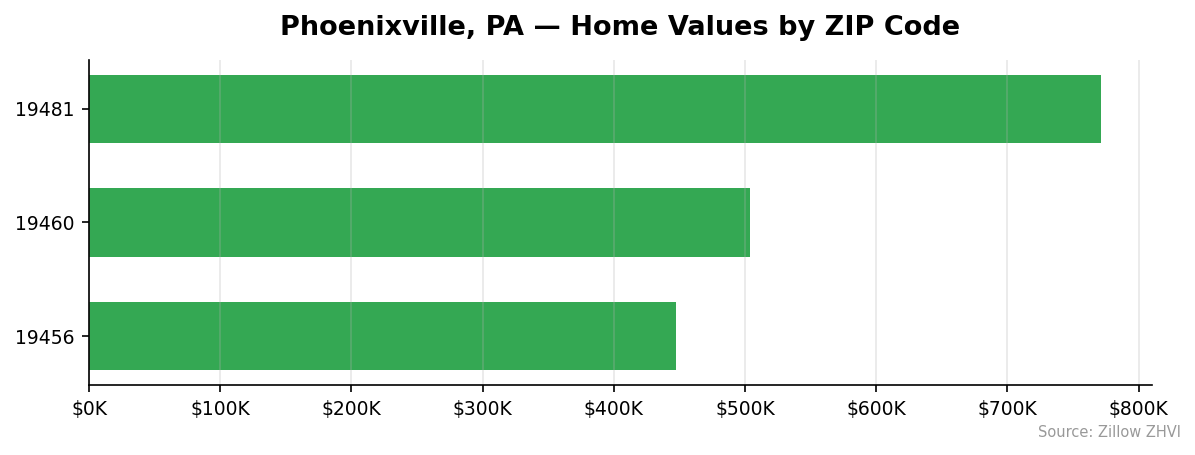
Three ZIP codes cover the Phoenixville area. They look very different on paper.
| ZIP Code | Typical Home Value | Vs City Avg |
|---|---|---|
| 19481 | $771,391 | +34% |
| 19460 | $504,023 | -12% |
| 19456 | $447,444 | -22% |
Most Expensive
- 19481 — $771,391. This is the high end of the local market, sitting more than $300K above the next ZIP. It’s a small, less dense pocket where housing stock skews larger and pricier.
- 19460 — $504,023. The mid-tier ZIP, and the only one with rental data tracked by Zillow. Roughly half a million dollars buys you a typical home here.
- 19456 — $447,444. Even the cheapest Phoenixville ZIP sits above $440K, which tells you the floor of this market is high.
Most Affordable
- 19456 — $447,444. The cheapest entry point in Phoenixville, but still well above the median U.S. home price.
- 19460 — $504,023. The middle option. Buyers here also have the clearest rental data to compare against.
- 19481 — $771,391. Not affordable in any conventional sense — but it’s the third ZIP in town, and it bookends the high side.
Rent vs Buy in Phoenixville
Rent data is only tracked for ZIP 19460 in Phoenixville. The Zillow Observed Rent Index puts the typical monthly rent there at about $2,023.
Compare that to owning. A typical home in 19460 runs $504,023. With a 20% down payment, you’d be financing roughly $403,000. At current mortgage rates, the principal and interest payment alone would land in the mid-$2,000s per month — and that’s before property taxes, homeowners insurance, and maintenance, which in Chester County easily add another $700 to $1,000 monthly.
Run the numbers and the math points one way for now: renting at $2,023 is the cheaper monthly outlay than buying. You’d need a multi-year hold and continued price appreciation for the buy side to win on cost alone.
That said, the buy-vs-rent decision isn’t only about monthly cash flow. Owners build equity. Renters don’t. With Phoenixville prices climbing 1.6% annually, a buyer in 19460 would have gained roughly $8,000 in paper equity over the last year. Whether that beats the cash flow gap depends on how long you plan to stay.
If you’re a short-term resident — under three or four years — renting wins clearly. Past that, the math gets closer.
Phoenixville Housing Market Trends
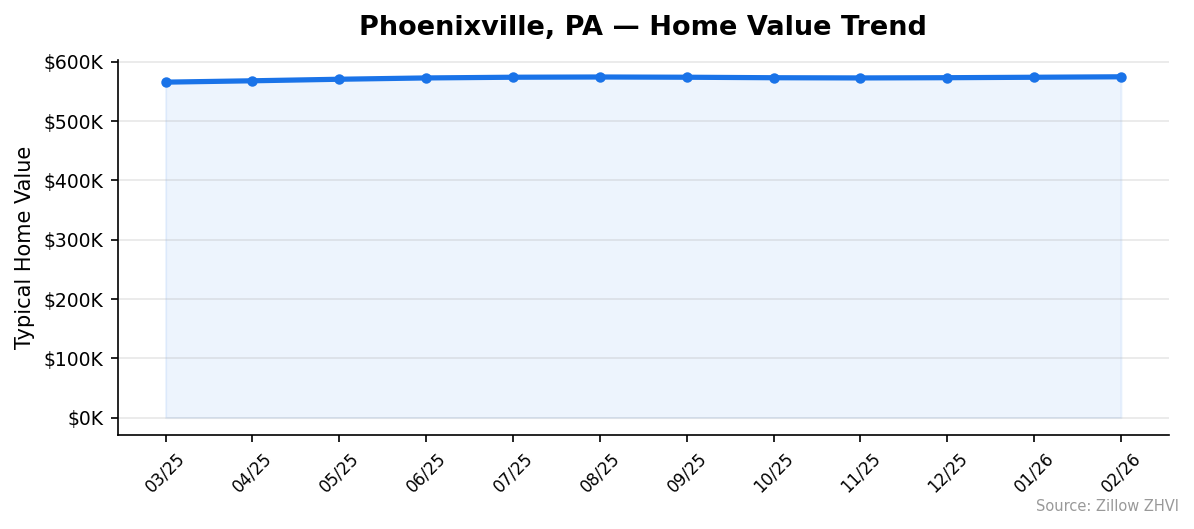
The 12-month picture is one word: steady.
| Month | Avg Home Value |
|---|---|
| Feb 2026 | $574,286 |
| Jan 2026 | $573,502 |
| Dec 2025 | $572,755 |
| Nov 2025 | $572,365 |
| Oct 2025 | $572,704 |
| Sep 2025 | $573,547 |
| Aug 2025 | $573,942 |
| Jul 2025 | $573,547 |
| Jun 2025 | $572,351 |
| May 2025 | $570,141 |
| Apr 2025 | $567,541 |
| Mar 2025 | $565,260 |
The bottom of the year was March 2025 at $565,260. The top is the most recent reading, $574,286. That’s a $9,026 gain across 12 months — a tight, slow upward grind.
There was a small dip in October and November when values cooled by a few hundred dollars, but the market quickly shrugged it off and resumed climbing. Nothing in this chart resembles volatility. If anything, Phoenixville looks more like a price plateau with a faint upward tilt than a market in motion.
Is Phoenixville a Good Place to Buy in 2026?
Phoenixville right now is a slow market — and slow can be good for buyers. A 1.6% annual gain means sellers don’t have much pricing power. There’s no bidding war frenzy reflected in these numbers.
The ZIP-level data also gives you real choices. You can pay $447K in 19456 or stretch to $771K in 19481 with the same town listed on the deed. That kind of spread is rare and useful.
The catch: even the cheap ZIP starts above $440K. If you’re priced out at that level, no amount of patience changes the floor. This is a market for buyers who can comfortably qualify at $400K-plus and want a Chester County address with proximity to the Philadelphia metro.
For sellers, the picture is fine but not exciting. You’ll probably get your price. You probably won’t get a windfall.
Phoenixville Housing Market Outlook for 2026-2027
The 3-month trend is unambiguous. December $572,755, January $573,502, February $574,286 — three straight months of small gains, averaging about $765 per month.
If the current pace continues, Phoenixville home values would clear $580K by mid-2026 and approach $585K by year-end. That would extend a year-long pattern of gradual appreciation rather than break from it.
The wider 12-month trajectory tells the same story. There’s no acceleration, no sharp drop, no inflection point in the data. Nothing in the recent monthly movements suggests the market is about to break in either direction.
The honest forecast is boring: more of the same. Slow, single-digit annual appreciation, with the high-end ZIP 19481 likely setting the pace and the cheaper ZIPs trailing close behind.
Similar Markets in PA
If Phoenixville’s $574K median puts you over budget, other Pennsylvania markets offer a different starting point.
- Philadelphia — the metro’s anchor city, generally cheaper than its Chester County suburbs.
- Lancaster — a separate metro about an hour west, with a different price profile.
- Allentown — Lehigh Valley alternative with distinct fundamentals.
- Reading — typically more affordable than the Philadelphia suburbs.
- Harrisburg — the state capital and a value option for buyers willing to commute.
Frequently Asked Questions
What is the average home price in Phoenixville?
The average home price in Phoenixville, PA is $574,286 as of February 2026. That figure is based on the Zillow Home Value Index across the area’s three ZIP codes, where typical values range from $447,444 in 19456 to $771,391 in 19481.
Are home prices going up or down in Phoenixville?
Prices are up 1.6% year over year. The trend has been steady — values have ticked up almost every month since March 2025, gaining roughly $9,000 over the past 12 months. There’s no sign of either a boom or a correction in the recent data.
Is it cheaper to rent or buy in Phoenixville?
Renting is currently cheaper on a monthly basis. The Zillow Observed Rent Index for ZIP 19460 puts typical rent near $2,023, while a mortgage on a $504K home in the same ZIP would run several times that amount once you factor in principal, interest, taxes, and insurance. Buying makes more sense if you plan to stay long enough to benefit from appreciation and equity.
What is the most affordable neighborhood in Phoenixville?
ZIP 19456 is the most affordable area, with a typical home value of $447,444. That’s about 22% below the city’s $574K average. Even so, it’s the floor of a market where every ZIP starts above $440K.
Methodology
Home values are based on the Zillow Home Value Index (ZHVI), a smoothed measure of typical home values in the 35th to 65th percentile range. Rent estimates use the Zillow Observed Rent Index (ZORI). Population figures come from the U.S. Census Bureau Population Estimates Program (2020-2024 vintage). All datasets are publicly available. Housing data updated 2026-02-28.