Reading Home Prices: $245K, Up 2.8% — 9 ZIPs Analyzed (2026)
$245,408. That’s what a typical home costs in Reading, PA right now. Prices are up 2.8% from a year ago, and they’ve climbed every single month since March 2025.
Quick answer: The average home price in Reading, PA is $245,408 as of February 2026, up 2.8% year over year according to Zillow.
Current Home Prices in Reading
Reading sits well below the national median. The typical home here costs less than half of what you’d pay in most coastal metros, and the city is one of the cheaper buys in eastern Pennsylvania.
| Metric | Value |
|---|---|
| Median home price | $245,408 |
| Year-over-year change | +2.8% |
| Cheapest ZIP | $135,505 (19602) |
| Most expensive ZIP | $379,272 (19608) |
| ZIPs covered | 9 |
| Data through | February 2026 |
The price spread tells you something. The gap between the cheapest and most expensive ZIPs is $243,767 — meaning the priciest neighborhood costs nearly three times as much as the cheapest. That’s a wide range for a city of 96,000 people.
Year-over-year growth of 2.8% puts Reading in the slow-and-steady column. It’s not a boom, but prices aren’t falling either. For context, this matches the broader Pennsylvania pattern, where smaller cities have posted modest gains while larger metros like Philadelphia have flattened out.
If you’re shopping near the median, you’re looking at homes in the $230K-$260K range. That puts Reading firmly in reach for buyers priced out of Lancaster, Bethlehem, or the Philadelphia suburbs.
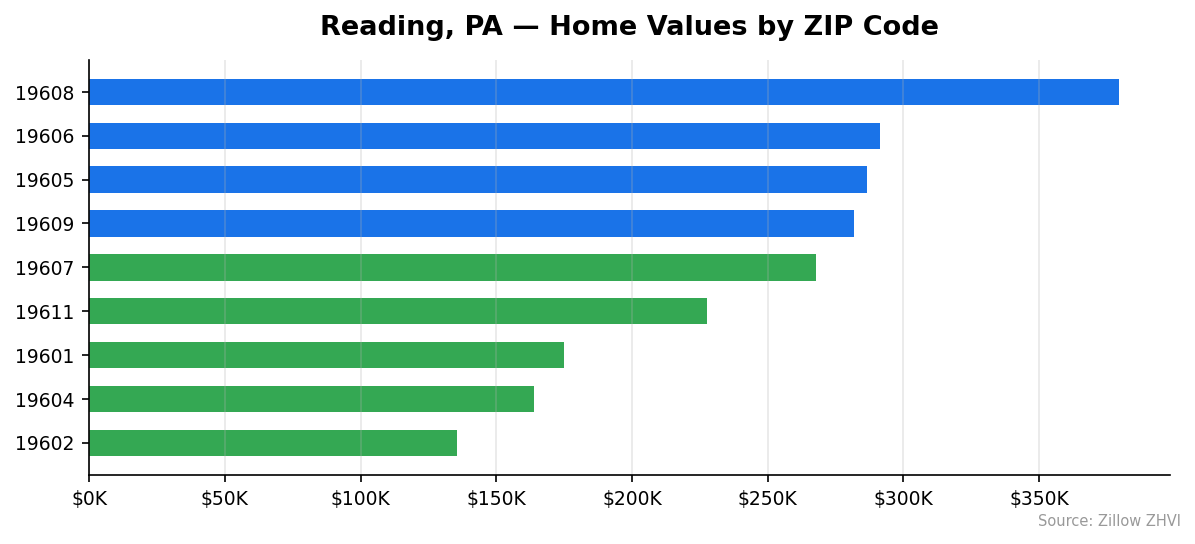
Reading Home Prices by Neighborhood
Reading has nine ZIP codes with reliable data, and the price differences between them are substantial. Where you buy matters more than what you buy.
| ZIP | Typical Home Value | Avg Rent |
|---|---|---|
| 19608 | $379,272 | $1,596 |
| 19606 | $291,283 | Not available |
| 19605 | $286,592 | Not available |
| 19609 | $281,919 | $1,710 |
| 19607 | $267,688 | $1,699 |
| 19611 | $227,606 | $1,704 |
| 19601 | $174,999 | $1,270 |
| 19604 | $163,808 | $1,409 |
| 19602 | $135,505 | $1,228 |
Most Expensive
19608 — $379,272. The priciest ZIP in Reading, sitting 55% above the city median. Rent here averages $1,596, which is actually lower than several cheaper ZIPs.
19606 — $291,283. Second most expensive, about 19% above the city average. No rent data is reported for this area.
19605 — $286,592. Third on the list, with values close to 19606. Like its neighbor, rent figures aren’t tracked here.
Most Affordable
19602 — $135,505. The cheapest ZIP in Reading, 45% below the city median. Rents are also the lowest at $1,228, which keeps this area affordable for renters and buyers alike.
19604 — $163,808. Second cheapest, about 33% under the city average. Rent runs $1,409, in the middle of the pack.
19601 — $174,999. Third on the affordability list, 29% below median. The $1,270 average rent is close to 19602’s level.
Rent vs Buy in Reading
Average rent across the seven Reading ZIPs with data lands at roughly $1,517 per month. Compare that to what a mortgage costs on a typical Reading home.
A $245,408 purchase with 20% down ($49,082 cash) leaves a $196,326 loan. At a 7% 30-year fixed rate, that’s $1,306 a month in principal and interest. Add property taxes (Pennsylvania runs around 1.5% of assessed value, or roughly $300/month) and homeowners insurance (roughly $100/month), and you’re at about $1,706 monthly.
| Scenario | Monthly Cost |
|---|---|
| Average rent (ZORI) | ~$1,517 |
| Mortgage P&I only | $1,306 |
| Mortgage + tax + insurance | ~$1,706 |
Renting wins on monthly cash flow by about $190. That doesn’t account for the $49K down payment sitting in your savings, or the maintenance costs every homeowner eats. On the other hand, owning builds equity and locks in your housing cost against future rent hikes.
The rent-buy gap in Reading is small. In high-cost markets, mortgages can run $1,000+ above rent. Here it’s tight, which means the math depends mostly on how long you plan to stay. Five years or more, buying usually wins. Less than three, renting almost always does.
Population Growth and Migration
Reading is gaining residents, but slowly. The city added about 1,017 people between 2020 and 2024 — a 1.1% gain over four years.
| Year | Population |
|---|---|
| 2020 | 94,983 |
| 2021 | 94,963 |
| 2022 | 95,011 |
| 2023 | 95,353 |
| 2024 | 96,000 |
The trend dipped slightly in 2021, then turned positive. Each of the last three years has added roughly 350 to 650 residents. That’s modest growth, not a population boom, but it’s the right direction.
Compare Reading to other Pennsylvania cities to see where it fits.
| City | 2024 Population | 4-Year Growth |
|---|---|---|
| Bethlehem | 79,453 | +4.9% |
| Pittsburgh | 307,668 | +1.6% |
| Reading | 96,000 | +1.1% |
| Allentown | 127,138 | +1.1% |
| Harrisburg | 50,649 | +1.1% |
| Lancaster | 58,441 | +0.9% |
Reading is keeping pace with Allentown and Harrisburg. Bethlehem stands out as the fastest-growing city on this list. Pittsburgh has stabilized after years of decline.
What this means for housing: demand is rising, but not aggressively. Steady population growth supports the kind of slow price appreciation Reading has seen — about 2-3% annually rather than double-digit jumps.
Reading Housing Market Trends
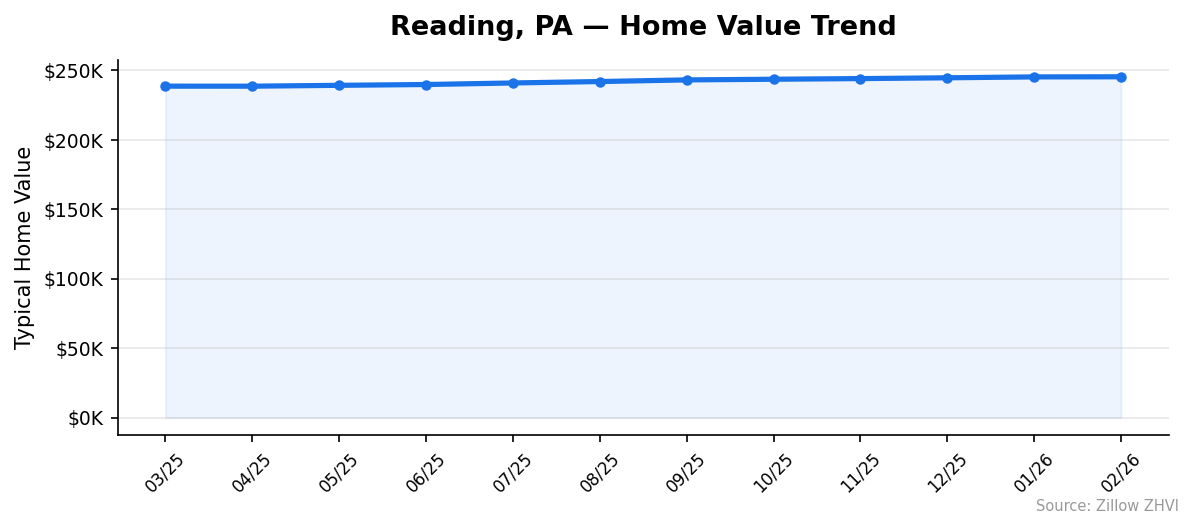
Reading prices have moved one direction for nearly a year: up.
| Month | Median Value |
|---|---|
| Feb 2026 | $245,408 |
| Jan 2026 | $245,327 |
| Dec 2025 | $244,685 |
| Nov 2025 | $244,111 |
| Oct 2025 | $243,643 |
| Sep 2025 | $243,166 |
| Aug 2025 | $241,984 |
| Jul 2025 | $240,963 |
| Jun 2025 | $239,844 |
| May 2025 | $239,264 |
| Apr 2025 | $238,648 |
| Mar 2025 | $238,662 |
Eleven straight months of gains. From March 2025 to February 2026, the typical Reading home rose $6,746 — a 2.8% climb that maps directly to the year-over-year figure.
The gains have been steady rather than explosive. Most months added between $400 and $1,200 to the median. The biggest jump came between July and August 2025, when prices climbed about $1,021 in a single month.
You don’t see this kind of consistency in volatile markets. Reading’s pattern looks like a slow, durable uptrend — the kind of market where you can plan ahead instead of timing the bottom.
Is Reading a Good Place to Buy in 2026?
The data points to a balanced market tilting slightly toward sellers.
Prices are rising, but at a pace buyers can keep up with. A 2.8% annual gain doesn’t price you out the way a 15% surge does. The cheapest ZIP starts at $135,505, which means a working-class buyer with $30K saved still has a path to ownership.
For sellers, the steady gains mean you’re not in a panic to list. Holding another year likely adds 2-3% to your sale price if current trends hold.
For buyers, the question is whether to wait for a correction. There’s no sign of one in the data. Eleven straight months of gains, modest population growth, and a small rent-buy gap all point toward continued strength. If you can afford the monthly payment and plan to stay, the math works.
The real risk in Reading isn’t a price crash. It’s mortgage rates. At 7%, monthly costs eat your budget before the home price does. If rates drop, more buyers enter the market and prices likely accelerate. If rates rise, prices may flatten — but they’d have to climb a lot more before Reading becomes overpriced.
Reading Housing Market Outlook for 2026-2027
The 11-month uptrend hasn’t shown signs of slowing. The most recent three months — December, January, February — added $81, $642, and $574 respectively, with no clear deceleration.
If the current pace continues, expect the typical Reading home to clear $250,000 by mid-2026 and approach $255,000 by year-end. That’s not a forecast based on outside reports — it’s a straight-line projection from the existing trend.
Two factors could change that path. A drop in mortgage rates would likely accelerate gains by pulling sidelined buyers back into the market. A spike in rates or a regional employment shock would flatten the line. Reading’s slow population growth offers some downside protection: there’s no oversupply story here, and demand isn’t speculative.
The 3-month trend suggests stability, not a turning point. Watch for any month where the median falls — that would be the first signal worth taking seriously. Through early 2026, the data hasn’t given that signal.
Similar Markets in PA
Reading sits in the affordable middle of Pennsylvania’s housing market. If you’re shopping the state, here are nearby comparisons worth a look.
- Allentown — A larger city with similar growth, often compared to Reading for cost-of-living reasons.
- Lancaster — A pricier neighbor with different employment drivers and a tighter housing supply.
- Bethlehem — The fastest-growing comparison city, where rising demand is pushing prices faster than in Reading.
- Harrisburg — The state capital, with growth rates that match Reading nearly exactly.
- York — Another mid-size Pennsylvania city often weighed against Reading by buyers wanting affordability.
Frequently Asked Questions
What is the average home price in Reading?
The typical home in Reading, PA is worth $245,408 as of February 2026. Prices range from $135,505 in the most affordable ZIP to $379,272 in the most expensive. The citywide figure represents the middle 35-65% of homes.
Are home prices going up or down in Reading?
Reading prices are up 2.8% over the past 12 months and have risen every single month since March 2025. The median climbed from $238,662 to $245,408 in that span. There’s no sign of a reversal in the recent data.
Is it cheaper to rent or buy in Reading?
Renting is cheaper month to month — by about $190. Average rent runs $1,517 across Reading ZIPs, while a typical mortgage with taxes and insurance costs roughly $1,706 on a $245K home with 20% down at 7% interest. Buying makes more sense if you plan to stay 5+ years.
What is the most affordable neighborhood in Reading?
ZIP 19602 has the lowest typical home value at $135,505 — about 45% below the city median. Rent there averages $1,228, also the cheapest in Reading. ZIPs 19604 ($163,808) and 19601 ($174,999) are the next two most affordable areas.
Methodology
Home values are based on the Zillow Home Value Index (ZHVI), a smoothed measure of typical home values in the 35th to 65th percentile range. Rent estimates use the Zillow Observed Rent Index (ZORI). Population figures come from the U.S. Census Bureau Population Estimates Program (2020-2024 vintage). All datasets are publicly available. Housing data updated 2026-02-28.