Philadelphia Home Prices: $275K, Up 2.4% — 46 ZIPs Analyzed (2026)
$275,094. That’s what a typical home costs in Philadelphia right now. Prices are up 2.4% from a year ago, and the city has posted twelve straight months of gains. The gap between the cheapest and most expensive ZIP codes? Over $800,000.
Quick answer: The average home price in Philadelphia, PA is $275,094 as of February 2026, up 2.4% year over year according to Zillow.
Current Home Prices in Philadelphia
Philadelphia sits well below the national spotlight cities in price, but the market is moving upward at a steady clip. Here’s where things stand:
| Metric | Value |
|---|---|
| Median home value | $275,094 |
| Year-over-year change | +2.4% |
| Lowest ZIP value | $70,404 |
| Highest ZIP value | $877,369 |
| Number of ZIP codes tracked | 46 |
| Data as of | February 2026 |
A 2.4% annual increase translates to roughly $6,500 in equity gained over the past year for the median homeowner. That’s modest compared to Sun Belt markets that saw double-digit swings during the pandemic years, but it reflects something Philadelphia has going for it: consistency.
The price floor is remarkably low. At $70,404, the cheapest ZIP code in Philadelphia costs less than a new pickup truck. Meanwhile, the ceiling stretches to $877,369 — more than twelve times the floor. That spread tells you Philadelphia isn’t one market. It’s dozens.
Month over month, the median ticked up $969 from January to February 2026. Not a surge. Not a stall. The kind of slow, grinding appreciation that doesn’t make headlines but builds wealth over time.
Philadelphia Home Prices by Neighborhood
All 46 tracked ZIP codes, sorted from most to least expensive:
| ZIP Code | Median Home Value | Typical Rent |
|---|---|---|
| 19118 | $877,369 | $1,882 |
| 19147 | $471,366 | $1,847 |
| 19123 | $460,116 | $2,055 |
| 19103 | $449,611 | $2,213 |
| 19130 | $430,405 | $1,961 |
| 19106 | $392,111 | $2,197 |
| 19116 | $387,218 | $1,740 |
| 19146 | $383,970 | $1,969 |
| 19115 | $379,196 | $1,597 |
| 19102 | $364,315 | $2,145 |
| 19125 | $363,996 | $1,785 |
| 19119 | $359,474 | $1,650 |
| 19128 | $357,223 | $1,808 |
| 19127 | $342,526 | $2,204 |
| 19152 | $318,586 | $1,622 |
| 19114 | $317,093 | $1,492 |
| 19154 | $316,731 | $1,788 |
| 19107 | $310,562 | $1,942 |
| 19129 | $309,275 | $1,875 |
| 19122 | $297,930 | $1,823 |
| 19111 | $290,718 | $1,444 |
| 19148 | $257,177 | $1,697 |
| 19145 | $246,189 | $1,727 |
| 19150 | $235,506 | $1,550 |
| 19136 | $233,607 | $1,552 |
| 19137 | $228,380 | $1,468 |
| 19126 | $224,484 | $1,215 |
| 19149 | $221,442 | $1,550 |
| 19104 | $218,882 | $1,811 |
| 19153 | $214,421 | $1,294 |
| 19135 | $203,599 | $1,429 |
| 19151 | $200,617 | $1,458 |
| 19121 | $191,573 | $1,674 |
| 19144 | $186,825 | $1,475 |
| 19138 | $175,680 | $1,550 |
| 19120 | $168,001 | $1,516 |
| 19124 | $168,757 | $1,258 |
| 19131 | $160,964 | $1,597 |
| 19141 | $160,842 | $1,189 |
| 19143 | $142,539 | $1,468 |
| 19139 | $133,018 | $1,439 |
| 19142 | $134,260 | $1,444 |
| 19134 | $118,411 | $1,352 |
| 19140 | $95,837 | $1,300 |
| 19133 | $83,137 | $1,469 |
| 19132 | $70,404 | $1,369 |
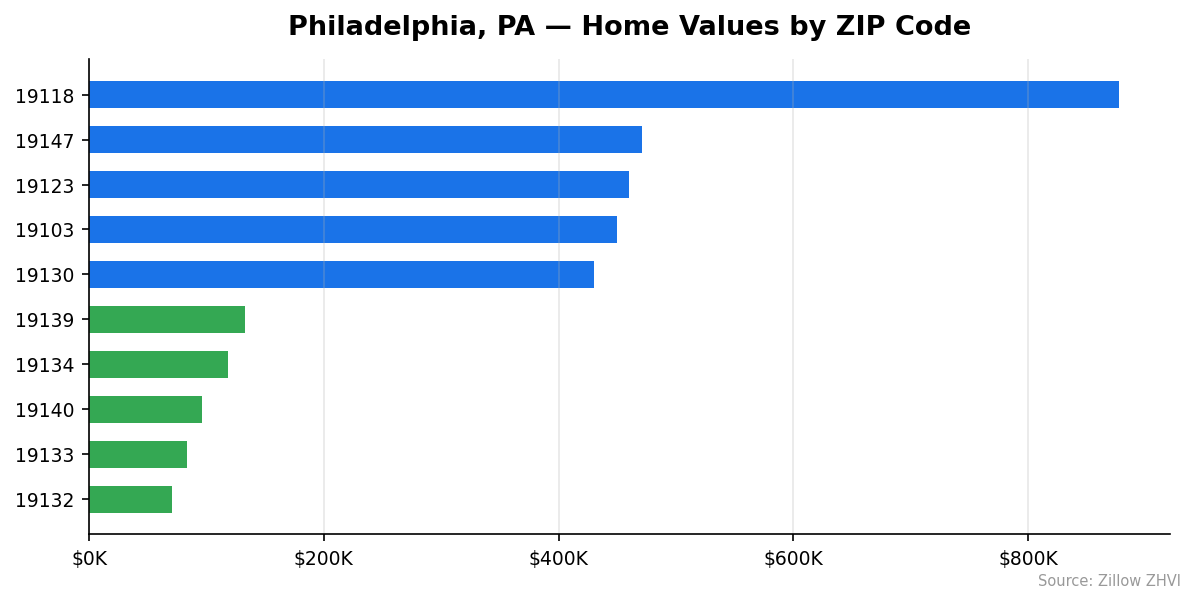
Most Expensive ZIP Codes
19118 — $877,369. Chestnut Hill commands a price more than three times the city median, yet typical rents sit at $1,882 — lower than several Center City ZIPs, suggesting most residents own rather than rent.
19147 — $471,366. South Philadelphia’s 19147 carries a median nearly $200K above the citywide figure, with rents at $1,847 reflecting strong demand from both buyers and renters.
19123 — $460,116. Northern Liberties and surrounding blocks price in at $460K, with rents topping $2,055 — one of the highest rent figures in the city.
Most Affordable ZIP Codes
19132 — $70,404. The most affordable ZIP in Philadelphia, priced at just 26% of the city median. Rents here run $1,369, meaning the rent-to-price ratio is extremely high — a signal of an investor-heavy market.
19133 — $83,137. At $83K, homes in 19133 cost less than many cars. Rents of $1,469 are disproportionately high relative to home values.
19140 — $95,837. The third cheapest ZIP still comes in under $100K, with rents at $1,300.
Rent vs Buy in Philadelphia
The math on renting versus buying depends heavily on which neighborhood you’re looking at.
At the citywide median of $275,094, here’s what a purchase looks like:
| Scenario | Monthly Cost |
|---|---|
| Mortgage (20% down, 7% rate, 30-yr) | ~$1,464 |
| Mortgage (10% down, 7% rate, 30-yr) | ~$1,647 |
| Mortgage (5% down, 7% rate, 30-yr) | ~$1,738 |
Rents across Philadelphia range from $1,189 in ZIP 19141 to $2,213 in ZIP 19103. The city’s most common rent range falls between $1,400 and $1,800.
For a buyer putting 20% down, the base mortgage payment of $1,464 is competitive with — or cheaper than — rents in more than half of the city’s ZIP codes. Add property taxes and insurance (typically $300–$500/month in Philadelphia), and the total carrying cost rises to roughly $1,800–$2,000.
That puts buying and renting roughly at parity in many middle-tier neighborhoods. In high-end ZIPs like 19103 and 19106 where rents exceed $2,100, buying still pencils out better on a monthly basis if you can manage the down payment.
The calculus flips in the cheapest ZIPs. In 19132, a $70K home would carry a mortgage under $400/month, but rents are $1,369. That gap suggests rental demand from people who can’t access financing — a common pattern in low-income neighborhoods.
Population Growth and Migration
Philadelphia is losing residents. The city’s population dropped from 1,600,788 in 2020 to 1,573,916 in 2024 — a decline of 1.7% over four years.
| Year | Population |
|---|---|
| 2020 | 1,600,788 |
| 2021 | 1,589,918 |
| 2022 | 1,570,554 |
| 2023 | 1,563,349 |
| 2024 | 1,573,916 |
There’s a nuance here. After three years of decline, Philadelphia added about 10,500 residents between 2023 and 2024. Whether that’s a real reversal or a one-year blip remains to be seen.
How does Philadelphia compare to other Pennsylvania cities?
| City | 2024 Population | 4-Year Growth |
|---|---|---|
| Bethlehem | 79,453 | +4.9% |
| Pittsburgh | 307,668 | +1.6% |
| Allentown | 127,138 | +1.1% |
| Reading | 96,000 | +1.1% |
| Harrisburg | 50,649 | +1.1% |
Every other major Pennsylvania city in this comparison is growing. Philadelphia is the outlier. For the housing market, population loss usually means softer demand — which helps explain why price growth has stayed moderate at 2.4% rather than spiking.
Philadelphia Housing Market Trends
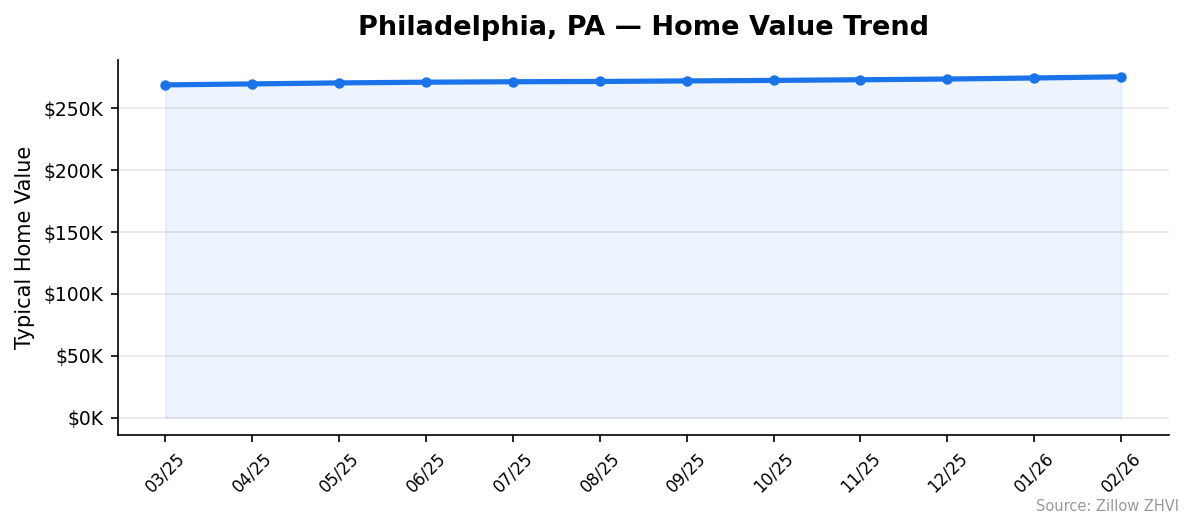
The 12-month trend shows unbroken gains, with acceleration in recent months:
| Month | Median Value | Monthly Change |
|---|---|---|
| March 2025 | $268,556 | — |
| April 2025 | $269,350 | +$794 |
| May 2025 | $270,159 | +$809 |
| June 2025 | $270,733 | +$574 |
| July 2025 | $271,099 | +$366 |
| August 2025 | $271,324 | +$225 |
| September 2025 | $271,767 | +$443 |
| October 2025 | $272,183 | +$416 |
| November 2025 | $272,699 | +$516 |
| December 2025 | $273,286 | +$587 |
| January 2026 | $274,125 | +$839 |
| February 2026 | $275,094 | +$969 |
Two patterns stand out. First, there hasn’t been a single down month in the past year. Second, the pace of gains slowed during summer 2025 — dropping to just $225 in August — then re-accelerated into 2026. February’s $969 increase was the largest monthly gain in the dataset.
Total appreciation over the 12-month window: $6,538, or about 2.4%.
The range between the cheapest and most expensive ZIPs also widened. In March 2025, the gap was $756,880. By February 2026, it had grown to $806,965. The top end is pulling away from the bottom.
Is Philadelphia a Good Place to Buy in 2026?
The data points to a buyer-friendly market with upward momentum.
At $275,094, Philadelphia’s median sits far below peer cities on the East Coast. The 2.4% annual appreciation means you’re not overpaying for a flat market, but you’re also not chasing a bubble. Twelve consecutive months of gains suggest underlying demand is real.
The risk factors: population is declining, which could cap long-term appreciation. The 2023-to-2024 population rebound deserves watching — if it holds, housing demand could strengthen further.
For buyers who can put 20% down, monthly mortgage costs are competitive with renting in most neighborhoods. That’s not always the case in major East Coast cities. The affordable ZIPs under $100K offer entry points that barely exist elsewhere in the Northeast.
If you’re buying to live in for five or more years, the slow-and-steady price trend favors you. If you’re speculating on rapid appreciation, the data doesn’t support that expectation.
Philadelphia Housing Market Outlook for 2026-2027
The three-month trend from December 2025 through February 2026 shows accelerating monthly gains: $587, $839, and $969. If that pace holds through spring and summer — historically the strongest buying months — Philadelphia could finish 2026 above $280,000.
The 12-month pattern suggests a seasonal slowdown is possible during mid-summer, as it was in 2025 when gains dropped below $400/month. A repeat of that pattern would put the market in the $278,000–$282,000 range by year-end.
Nothing in the data suggests a reversal. Every month gained, and the gains are getting larger. Barring a sharp rise in mortgage rates or an economic shock, prices are likely to continue grinding higher through 2027 at a pace similar to the 2-3% annual range.
Similar Markets in PA
If you’re exploring options beyond Philadelphia, these Pennsylvania cities offer different price points and growth profiles:
- Pittsburgh — PA’s second-largest city with 307,668 residents and 1.6% population growth, offering a smaller-city alternative with its own price dynamics.
- Allentown — Located in the Lehigh Valley about 60 miles north, Allentown’s 127K population is growing at 1.1%.
- Bethlehem — The fastest-growing city on this list at 4.9%, worth watching for demand-driven price appreciation.
- Reading — A smaller market with 96,000 residents and steady growth.
- Lancaster — A popular option for buyers priced out of Philadelphia’s suburbs.
Frequently Asked Questions
What is the average home price in Philadelphia?
The average home price in Philadelphia is $275,094 as of February 2026. This figure represents the Zillow Home Value Index, which tracks typical home values in the 35th to 65th percentile range. Prices vary widely by neighborhood — from $70,404 in ZIP 19132 to $877,369 in ZIP 19118.
Are home prices going up or down in Philadelphia?
Prices are going up. Philadelphia’s median home value increased 2.4% year over year, and the market has posted gains in all 12 of the most recent months tracked. The pace of appreciation accelerated in early 2026, with February recording the largest single-month gain at $969.
Is it cheaper to rent or buy in Philadelphia?
It depends on the neighborhood and your down payment. At the city median of $275,094, a 20% down mortgage costs about $1,464/month before taxes and insurance. Typical rents across the city range from $1,189 to $2,213. In most middle-tier and upper-tier neighborhoods, monthly buying costs are comparable to or lower than renting.
What is the most affordable neighborhood in Philadelphia?
ZIP code 19132 is the most affordable, with a typical home value of $70,404 — just 26% of the citywide median. ZIP codes 19133 ($83,137) and 19140 ($95,837) round out the three cheapest areas. All three carry rents that are disproportionately high relative to home prices.
Methodology
Home values are based on the Zillow Home Value Index (ZHVI), a smoothed measure of typical home values in the 35th to 65th percentile range. Rent estimates use the Zillow Observed Rent Index (ZORI). Population figures come from the U.S. Census Bureau Population Estimates Program (2020-2024 vintage). All datasets are publicly available. Housing data updated 2026-02-28.