Norfolk Home Prices: $318K, Up 0.4% — 12 ZIPs Analyzed (2026)
$317,794. That’s the typical home value in Norfolk as of February 2026 — up just 0.4% from a year ago. After a soft summer in 2025, prices have ticked higher every month since July.
Quick answer: The average home price in Norfolk, VA is $317,794 as of February 2026, up 0.4% year over year according to Zillow.
Current Home Prices in Norfolk
Norfolk sits well below the Virginia state average and far below pricier neighbors like Virginia Beach and Chesapeake. The market is flat — not falling, not booming.
| Metric | Value |
|---|---|
| Median home value | $317,794 |
| Year-over-year change | +0.4% |
| Cheapest ZIP | $249,986 (23523) |
| Most expensive ZIP | $473,437 (23507) |
| ZIP codes tracked | 12 |
| Data through | February 2026 |
The spread between the cheapest and priciest Norfolk ZIP is roughly $223,000. That’s wide for a single city. ZIP 23507 — the medical center area — pulls the top end of the range nearly $156,000 above the city median. The bottom end sits in the southeastern neighborhoods near Berkley and Campostella.
The 0.4% annual gain is essentially flat in real terms. With inflation running above that, Norfolk homeowners aren’t getting wealthier in 2026 — they’re treading water. For buyers, that’s a different story. Stable prices mean less pressure to overbid, and the city’s median price is roughly $100,000 below Chesapeake’s typical range.
The Virginia Beach-Norfolk-Newport News metro is the largest in coastal Virginia, anchored by the Navy and the Port of Virginia. Norfolk itself is the urban core — older housing stock, denser neighborhoods, lower prices than the suburbs that surround it.
Norfolk Home Prices by Neighborhood
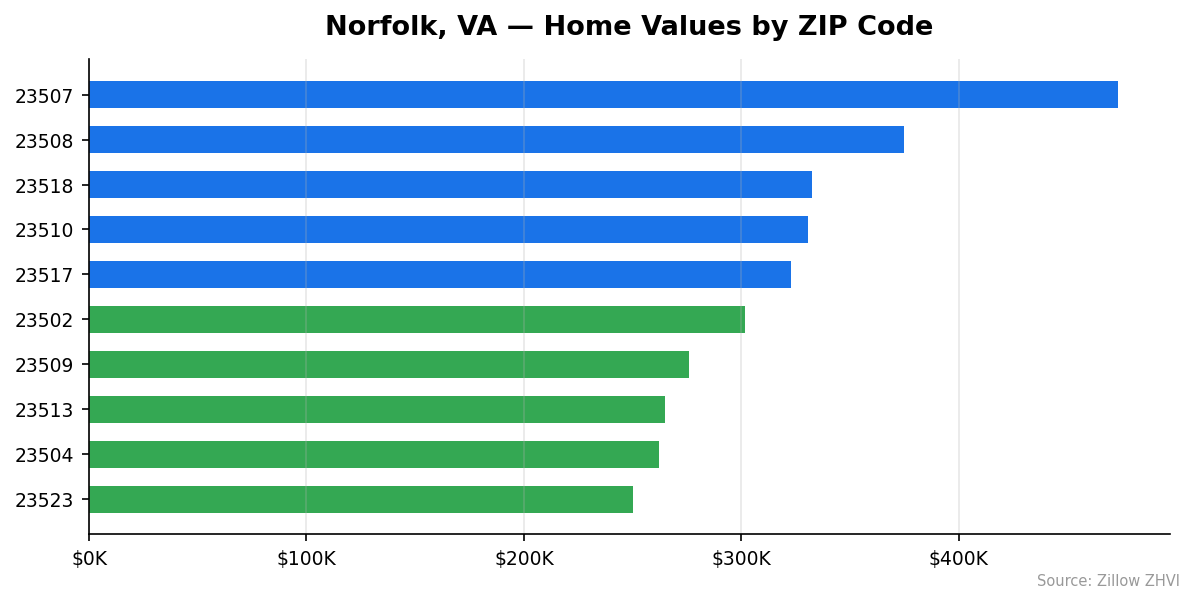
Twelve Norfolk ZIPs are tracked. Here’s the breakdown, sorted from cheapest to most expensive:
| ZIP Code | Home Value | Typical Rent |
|---|---|---|
| 23523 | $249,986 | — |
| 23504 | $262,131 | $1,584 |
| 23513 | $264,690 | $1,590 |
| 23509 | $275,757 | $1,931 |
| 23502 | $301,915 | $2,028 |
| 23503 | $305,982 | $1,488 |
| 23505 | $318,848 | $1,569 |
| 23510 | $330,594 | $1,751 |
| 23517 | $322,916 | $1,680 |
| 23518 | $332,608 | $1,991 |
| 23508 | $374,660 | $1,829 |
| 23507 | $473,437 | $1,503 |
Most Expensive
- 23507 at $473,437. The Ghent and medical center corridor — the priciest ZIP by a wide margin, nearly 49% above the city median. Rents here are surprisingly low at $1,503, suggesting older condos and small units pull the rent average down.
- 23508 at $374,660. The Larchmont and Old Dominion University area. Prices run 18% above the city median with rents near $1,829.
- 23518 at $332,608. East Ocean View on the northern edge. Sits 5% above the median with the highest rents in this group at $1,991.
Most Affordable
- 23523 at $249,986. The cheapest ZIP in Norfolk, 21% below the city median. Located south of the Elizabeth River.
- 23504 at $262,131. Central Norfolk including parts of Park Place. Rents around $1,584 — close to the city average.
- 23513 at $264,690. Norview and the area near Norfolk International Airport. Rents at $1,590 line up with similar-priced ZIPs.
Rent vs Buy in Norfolk
Rents in Norfolk range from $1,488 in 23503 to $2,028 in 23502. The citywide average across the 11 ZIPs with rent data is roughly $1,723.
Now the buy side. A $317,794 home with 10% down at a 7% mortgage rate puts you near $1,902 in monthly principal and interest. Add property tax (Norfolk’s effective rate runs around 1.25%) and insurance, and you’re closer to $2,400 a month before HOA fees or maintenance.
| Path | Typical Monthly Cost |
|---|---|
| Rent (city average) | ~$1,723 |
| Buy (P&I only, 10% down) | ~$1,902 |
| Buy (with tax & insurance) | ~$2,400 |
Renting wins the monthly math by roughly $700 in Norfolk right now. The break-even tilts toward buying only if you stay long enough to build equity and prices keep appreciating — and at 0.4% annual growth, that math takes years.
ZIP 23507 is the outlier. Homes go for $473,437 but rent averages $1,503. Buying there at current rates means paying triple the rent in monthly carrying costs. ZIP 23502 flips the script — homes at $301,915 and rents at $2,028, the highest in the city. That’s the spot where the rent-vs-buy gap narrows the most.
Population Growth and Migration
Norfolk is losing people. The population dropped from 237,813 in 2020 to 231,105 in 2024 — a 2.8% decline over four years. The trend has been steady, not sudden.
| Year | Population |
|---|---|
| 2020 | 237,813 |
| 2021 | 234,920 |
| 2022 | 232,766 |
| 2023 | 231,378 |
| 2024 | 231,105 |
The decline is slowing — only 273 fewer residents in 2024 versus 2023. But four straight years of losses tell you something. People are leaving for the suburbs.
| City | 2024 Population | 4-Year Growth |
|---|---|---|
| Suffolk | 103,105 | +8.8% |
| Richmond | 233,655 | +3.0% |
| Chesapeake | 254,997 | +2.1% |
| Lynchburg | 80,301 | +1.7% |
| Hampton | 137,596 | +0.2% |
| Norfolk | 231,105 | -2.8% |
Suffolk gained 8.8% — the fastest growth in the region. Chesapeake added 2.1%. Both border Norfolk and offer newer housing stock, more land, and lower density. That’s where Norfolk’s outflow is going.
For housing demand, this matters. Falling population caps how fast prices can rise. The 0.4% year-over-year gain reflects that ceiling. Norfolk isn’t a city where bidding wars push prices up 10%. It’s a city where supply and demand are roughly balanced because demand is shrinking.
Norfolk Housing Market Trends
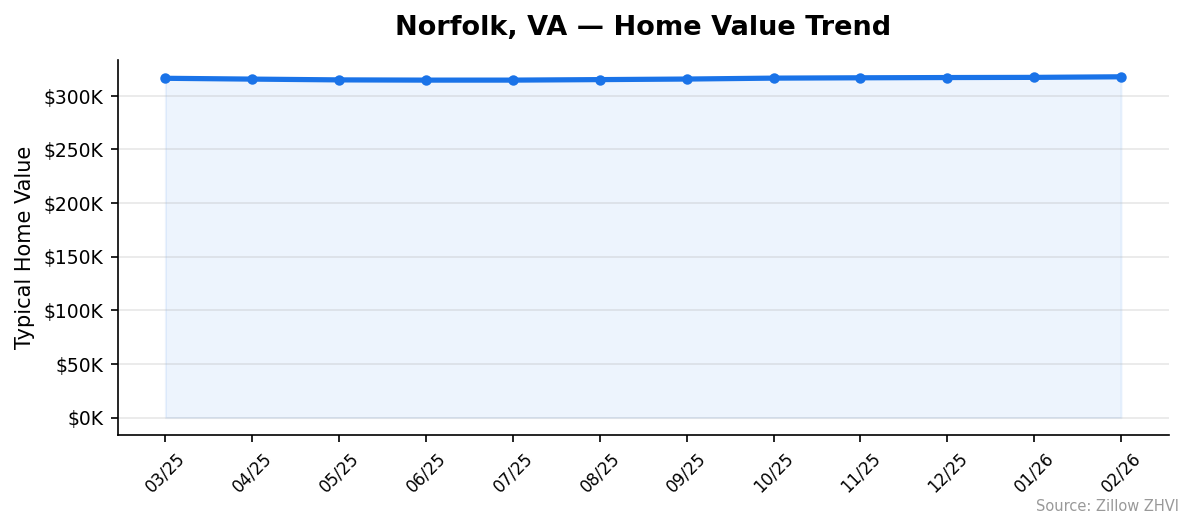
Here’s the 12-month price trail:
| Month | Median Value |
|---|---|
| March 2025 | $316,397 |
| April 2025 | $315,633 |
| May 2025 | $314,906 |
| June 2025 | $314,689 |
| July 2025 | $314,693 |
| August 2025 | $315,165 |
| September 2025 | $315,690 |
| October 2025 | $316,544 |
| November 2025 | $316,864 |
| December 2025 | $317,093 |
| January 2026 | $317,246 |
| February 2026 | $317,794 |
Prices bottomed in June 2025 at $314,689. Since then, eight straight months of small gains. The total recovery from the June low is $3,105 — about 1%. That’s measured, not explosive.
Compare it to the same point a year earlier: in March 2025, the median was $316,397. Today it’s $317,794. The market has gained $1,397 in twelve months. You’re looking at a market that moves like a tanker, not a speedboat.
The ceiling has been creeping up too. The most expensive ZIP value rose from $473,006 in March 2025 to $473,437 in February 2026 — basically unchanged. The bottom has held steadier than the top, which suggests entry-level demand is firmer than luxury demand in Norfolk right now.
Is Norfolk a Good Place to Buy in 2026?
The data points to a balanced market, leaning slightly toward buyers.
Prices are flat. Population is shrinking. The rent-vs-buy math favors renters by roughly $700 a month at current mortgage rates. None of that screams “buy now or miss out.”
But Norfolk also has the cheapest entry point in the metro. The $249,986 floor in ZIP 23523 is one of the few sub-$250K options anywhere in coastal Virginia. If you need to be near the Naval Station Norfolk, the Port of Virginia, or downtown jobs, the city’s housing stock is more affordable than Chesapeake or Virginia Beach by a wide margin.
For a long-term buyer planning to stay 7+ years, Norfolk’s stability is a feature, not a bug. You’re not buying at a peak. You’re not chasing appreciation. You’re paying for shelter at a fair price.
For investors? The rent-to-price ratios in ZIP 23502 (1:149) and ZIP 23509 (1:143) are stronger than most of the city. Those are the ZIPs where rental yield works.
Norfolk Housing Market Outlook for 2026-2027
The 3-month trend shows prices rising about $250 per month — a quarterly pace of roughly 0.2%. If the current pace continues, Norfolk would end 2026 near $320K, a tick above today.
The longer 8-month trend from the June 2025 low has averaged $388 per month. That pace would put the median around $322K by year-end 2026. Either way, the data points to slow, modest gains — not a breakout.
The headwinds are real. Population is falling. Rent-to-mortgage spreads favor renting. Suburban competition keeps pulling buyers to Suffolk and Chesapeake. The tailwinds are also real — entry prices are low, the floor has been firm, and the market hasn’t seen the corrections that hit some Sun Belt cities.
Expect more of the same: small monthly moves, a 0% to 2% annual range, and a market that rewards patience over speed.
Similar Markets in VA
- Hampton — Norfolk’s closest peer in price and population, just across the water.
- Chesapeake — The suburban alternative pulling Norfolk residents south.
- Virginia Beach — The pricier coastal neighbor with stronger demand.
- Suffolk — The fastest-growing Hampton Roads city if you want appreciation potential.
- Richmond — A larger urban market two hours northwest with different demand drivers.
Frequently Asked Questions
What is the average home price in Norfolk?
The average home price in Norfolk, VA is $317,794 as of February 2026. That figure reflects the Zillow Home Value Index across 12 ZIP codes within the city. Prices range from $249,986 in ZIP 23523 to $473,437 in ZIP 23507.
Are home prices going up or down in Norfolk?
Prices are up 0.4% year over year — essentially flat. The market bottomed at $314,689 in June 2025 and has gained ground every month since, but the total recovery is only about 1%. Norfolk is not a fast-moving market in either direction.
Is it cheaper to rent or buy in Norfolk?
Renting wins the monthly math right now. The city-average rent is around $1,723, while a mortgage on a $317,794 home with 10% down runs roughly $2,400 per month including taxes and insurance. That’s a $700 monthly gap favoring renters before factoring in maintenance or HOA fees.
What is the most affordable neighborhood in Norfolk?
ZIP 23523 is the cheapest at $249,986 — 21% below the city median. ZIPs 23504 ($262,131) and 23513 ($264,690) are the next two most affordable. All three sit well under $270K, making them the entry-level options for the city.
Methodology
Home values are based on the Zillow Home Value Index (ZHVI), a smoothed measure of typical home values in the 35th to 65th percentile range. Rent estimates use the Zillow Observed Rent Index (ZORI). Population figures come from the U.S. Census Bureau Population Estimates Program (2020-2024 vintage). All datasets are publicly available. Housing data updated 2026-02-28.