Tyler Home Prices: $240K, Down 2.5% — 9 ZIPs Analyzed (2026)
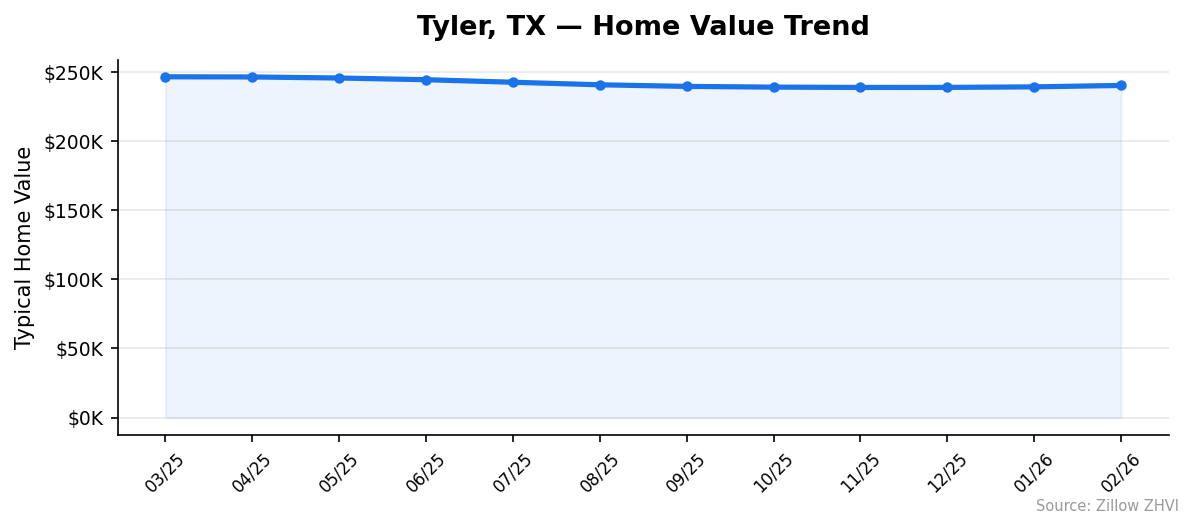
$240,282. That is what a typical Tyler home is worth as of February 2026, and the number has dropped 2.5% in the past year. The decline has been steady — prices peaked at $246,548 in March 2025 and have eased almost every month since.
Quick answer: The average home price in Tyler, TX is $240,282 as of February 2026, down 2.5% year over year according to Zillow.
Current Home Prices in Tyler
Tyler sits well below the Texas big-city average. Compared with Austin’s mid-$500Ks or Houston’s broader metro pricing, the East Texas market is one of the cheaper places to buy a home in the state.
| Metric | Value |
|---|---|
| Median home value | $240,282 |
| Year-over-year change | -2.5% |
| Highest ZIP value | $349,706 (75703) |
| Lowest ZIP value | $126,945 (75702) |
| Price spread | $222,761 |
| ZIPs tracked | 9 |
| Data through | February 2026 |
The spread between Tyler’s cheapest and priciest ZIPs is wider than the city median itself. A buyer with a $250K budget can pick from most neighborhoods, but the top-end areas have pulled away. The max ZIP value rose slightly over the past year while the min ZIP value dropped from $145,519 in March 2025 to $126,945 in February 2026 — a 12.8% decline at the low end of the market.
That divergence matters. It means the citywide -2.5% headline hides two different markets: an upper bracket holding firm and an entry-level segment losing value faster than the average suggests.
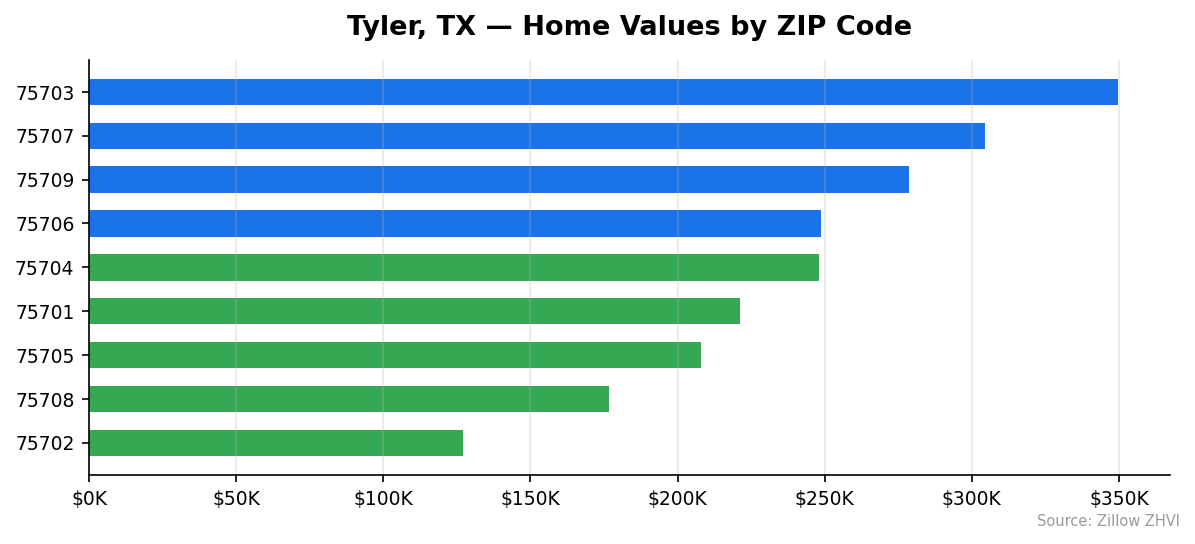
Tyler Home Prices by Neighborhood
Nine ZIP codes make up the Tyler housing market. Prices range from $126,945 to $349,706 — almost a 3x gap between cheapest and priciest.
| ZIP | Typical Home Value | vs City Median |
|---|---|---|
| 75703 | $349,706 | +45.5% |
| 75707 | $304,514 | +26.7% |
| 75709 | $278,693 | +16.0% |
| 75706 | $248,748 | +3.5% |
| 75704 | $247,930 | +3.2% |
| 75701 | $221,300 | -7.9% |
| 75705 | $207,937 | -13.5% |
| 75708 | $176,769 | -26.4% |
| 75702 | $126,945 | -47.2% |
Most Expensive
- 75703 — $349,706. The priciest ZIP in Tyler, sitting 45% above the city median. Despite the higher home values, ZORI rent here runs $1,195 — actually below the city’s other tracked rentals.
- 75707 — $304,514. The second-highest at 27% above median, and it carries the highest tracked rent in Tyler at $1,497 per month.
- 75709 — $278,693. Third on the list, 16% above the city average. No rent data is available for this ZIP.
Most Affordable
- 75702 — $126,945. The cheapest in Tyler by a wide margin, nearly half the city median. Rent in this ZIP runs $1,121, the lowest of the four tracked rental ZIPs.
- 75708 — $176,769. Roughly 26% below the median. No ZORI rent data is reported here.
- 75705 — $207,937. About 14% below median, with no tracked rent figures.
Rent vs Buy in Tyler
Rent data is available for four Tyler ZIPs. Median monthly rents range from $1,121 in 75702 to $1,497 in 75707.
| ZIP | Monthly Rent | Home Value |
|---|---|---|
| 75707 | $1,497 | $304,514 |
| 75701 | $1,468 | $221,300 |
| 75703 | $1,195 | $349,706 |
| 75702 | $1,121 | $126,945 |
The math favors renting in most cases. A 20% down payment on the $240,282 city median leaves about $192K to finance. At a 7% 30-year fixed rate, that is roughly $1,278 per month in principal and interest — before taxes, insurance, and maintenance. Add Texas property taxes (which run high) and the monthly carry typically pushes past $1,800.
That is a few hundred dollars above what most tracked rentals charge. Buying still wins long-term if you stay put — equity, fixed payment, no rent inflation. But for shorter horizons, renting is the cheaper option month to month in Tyler right now.
The 75702 case is striking. Home values there are $126,945, meaning a 20% down payment is just over $25K. A mortgage on the remaining balance would run around $675 a month before taxes and insurance — well under the $1,121 ZORI rent figure for the same ZIP.
Population Growth and Migration
Tyler grew from 106,269 residents in 2020 to 112,219 in 2024 — a 5.6% gain over four years.
| Year | Population |
|---|---|
| 2020 | 106,269 |
| 2021 | 107,399 |
| 2022 | 109,491 |
| 2023 | 110,731 |
| 2024 | 112,219 |
Growth has been steady, with about 1,500 new residents added each year on average. Compared to other Texas cities, Tyler’s pace lands in the middle.
| City | 2024 Population | 4-Year Growth |
|---|---|---|
| Fort Worth | 1,008,106 | 9.1% |
| San Antonio | 1,526,656 | 6.1% |
| Tyler | 112,219 | 5.6% |
| Lubbock | 272,086 | 5.4% |
| Houston | 2,390,125 | 4.0% |
| Austin | 993,588 | 2.9% |
Tyler is growing faster than Austin and Houston in percentage terms, though the absolute numbers are far smaller. A 5.6% gain in a city of 112,000 means roughly 5,950 new people — a real but modest addition to housing demand. That growth helps explain why prices have not collapsed despite the recent dip. Demand keeps pace with supply enough to prevent a sharp slide.
Tyler Housing Market Trends
Prices have moved down for most of the past 12 months. Here is the monthly trend.
| Month | Avg Value | Min ZIP | Max ZIP |
|---|---|---|---|
| Feb 2026 | $240,282 | $126,945 | $349,706 |
| Jan 2026 | $239,265 | $126,762 | $348,781 |
| Dec 2025 | $238,870 | $127,218 | $348,251 |
| Nov 2025 | $238,840 | $129,031 | $347,394 |
| Oct 2025 | $239,076 | $131,404 | $346,547 |
| Sep 2025 | $239,593 | $133,683 | $345,588 |
| Aug 2025 | $240,757 | $135,949 | $345,148 |
| Jul 2025 | $242,601 | $138,709 | $344,945 |
| Jun 2025 | $244,430 | $141,172 | $344,995 |
| May 2025 | $245,665 | $143,004 | $344,820 |
| Apr 2025 | $246,428 | $144,404 | $344,978 |
| Mar 2025 | $246,548 | $145,519 | $344,823 |
The peak was March 2025 at $246,548. Prices then slid for nine straight months, bottoming at $238,840 in November. Since then there has been a small bounce — three consecutive monthly gains, ending at $240,282 in February 2026.
The high end has been notably stable. The most expensive ZIP held between $344K and $350K all year, even climbing slightly. The low end did the opposite, dropping nearly $19K from March 2025 to February 2026. Affordable Tyler is getting more affordable while expensive Tyler holds value.
Is Tyler a Good Place to Buy in 2026?
The data points to a buyer’s market with caveats. Prices have fallen 2.5% over the past year and the city has been below peak for almost a year. Inventory at the entry level is repricing fastest — if you are shopping under $200K, you have more bargaining room than you did in early 2025.
Three things support a purchase decision: population is growing at 5.6% over four years, the high end of the market is stable, and the recent three-month uptick suggests the bottom may be in. Against that, mortgage carry costs still exceed local rents, so the buy-versus-rent math only works if you plan to hold for several years.
A buyer who is patient and targets the lower-priced ZIPs — 75702, 75708, 75705 — has the strongest negotiating position right now. At the top of the market, prices are not moving and sellers know it.
Tyler Housing Market Outlook for 2026-2027
If the current pace continues, Tyler prices are flat to slightly up over the next few months. The 3-month trend through February 2026 shows three consecutive monthly increases of $30 to $1,000 each — a deceleration of the prior decline rather than a strong rebound.
The wider story is bifurcation. The minimum ZIP value has dropped every month for the past year while the maximum has crept up. Expect that gap to keep widening unless something changes at the low end. Population growth provides a floor under demand, but it is not strong enough on its own to drive a fast recovery.
Watch the next two quarters. If the small monthly gains continue through summer 2026, the year-over-year number will turn positive again. If the entry-level slide resumes, the citywide median could test the $238K mark from late 2025.
Similar Markets in TX
If you are weighing Tyler against other Texas cities, these comparisons help frame the choice:
- Houston — far larger metro with more inventory and faster turnover than Tyler.
- San Antonio — bigger city with more job diversity but typically higher home prices.
- El Paso — another mid-size Texas market worth comparing for affordability.
- Brownsville — South Texas option in a similar price range to Tyler.
- Grand Prairie — a DFW suburb if you want metro-area access at a different price point.
Frequently Asked Questions
What is the average home price in Tyler?
The average home price in Tyler, TX is $240,282 as of February 2026. That figure reflects the Zillow Home Value Index across nine tracked ZIP codes, with individual neighborhoods ranging from $126,945 to $349,706.
Are home prices going up or down in Tyler?
Prices are down 2.5% year over year. The market peaked at $246,548 in March 2025 and slid for nine straight months before posting three small monthly gains through February 2026. The recovery is mild, not sharp.
Is it cheaper to rent or buy in Tyler?
Renting is cheaper month to month. Tracked ZORI rents range from $1,121 to $1,497, while a mortgage on the $240K median home — with 20% down at current rates — typically costs $1,800+ per month including taxes and insurance. Buying wins long-term if you stay put for years.
What is the most affordable neighborhood in Tyler?
ZIP 75702 is the cheapest, with a typical home value of $126,945 — roughly 47% below the city median. Rent in 75702 also runs $1,121, the lowest of the four tracked rental ZIPs in Tyler.
Methodology
Home values are based on the Zillow Home Value Index (ZHVI), a smoothed measure of typical home values in the 35th to 65th percentile range. Rent estimates use the Zillow Observed Rent Index (ZORI). Population figures come from the U.S. Census Bureau Population Estimates Program (2020-2024 vintage). All datasets are publicly available. Housing data updated 2026-02-28.