Amarillo Home Prices: $206K, Up 1.9% — 13 ZIPs Analyzed (2026)
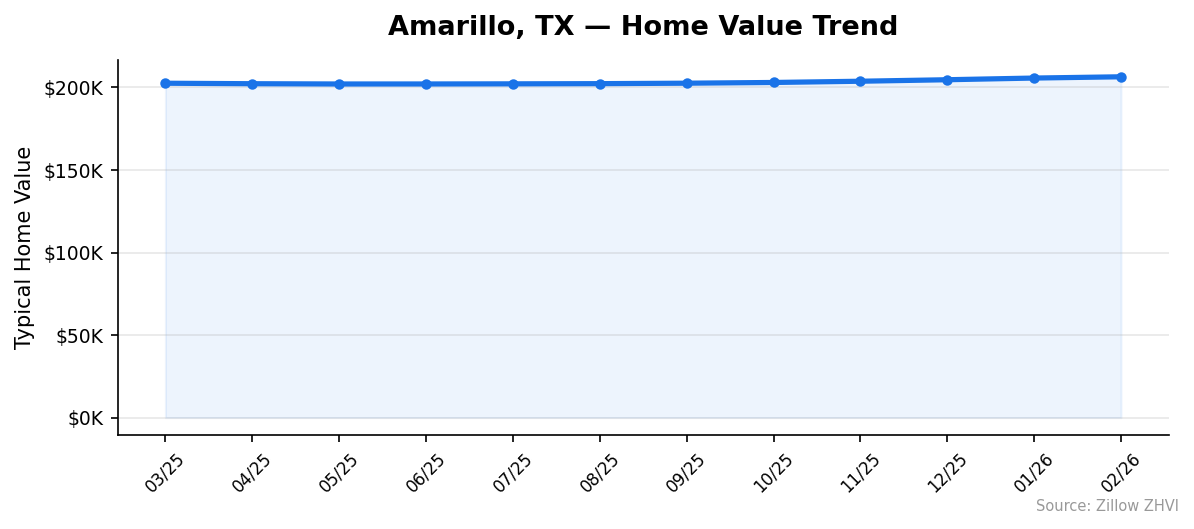
$206,462. That’s what a typical home costs in Amarillo, TX as of February 2026. Prices are up 1.9% year over year, and the trend has quietly accelerated since last summer.
Quick answer: The average home price in Amarillo, TX is $206,462 as of February 2026, up 1.9% year over year according to Zillow.
Current Home Prices in Amarillo
Amarillo remains one of the cheaper metros in Texas. The citywide median of $206,462 sits well below the state’s major markets, and the price range across its 13 tracked ZIPs stretches from barely over $100K to nearly $400K.
Here’s the current snapshot:
| Metric | Value |
|---|---|
| Median home value | $206,462 |
| Year-over-year change | +1.9% |
| Cheapest ZIP value | $106,996 (79101) |
| Most expensive ZIP value | $380,329 (79119) |
| ZIPs tracked | 13 |
| Data through | February 2026 |
The spread tells you everything about Amarillo. The most expensive ZIP is 3.5 times the cheapest. That kind of gap means buyer experience depends almost entirely on which side of town you’re shopping.
The 1.9% annual gain is modest. It’s slower than U.S. home price growth over the same period and well below the pace Amarillo itself logged in earlier years. But prices are not falling. That matters in 2026, when several large Sun Belt metros are posting year-over-year declines.
You also won’t find bidding wars in the data. Monthly values climbed gradually through all 12 reported months, suggesting steady, orderly demand rather than a spike.
For buyers, the headline number hides the real story: Amarillo is really several markets. Downtown and the north side are under $150K. The south and southwest run $250K and up. The citywide median is a midpoint that almost no actual home sits near.
Amarillo Home Prices by Neighborhood
| ZIP | Typical Home Value | Typical Rent |
|---|---|---|
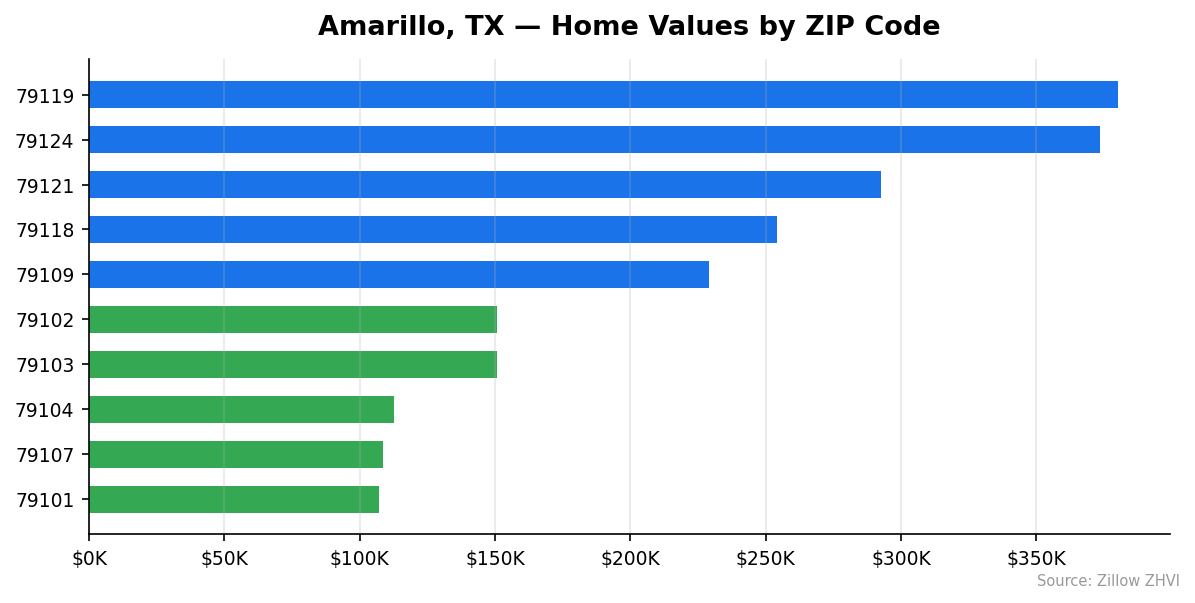
| 79119 | $380,329 | $1,665 |
| 79124 | $373,436 | — |
| 79121 | $292,555 | — |
| 79118 | $254,083 | $1,728 |
| 79109 | $229,203 | $1,258 |
| 79108 | $196,862 | — |
| 79110 | $166,028 | $1,336 |
| 79106 | $161,872 | $934 |
| 79102 | $150,834 | — |
| 79103 | $150,692 | — |
| 79104 | $112,538 | — |
| 79107 | $108,581 | $1,062 |
| 79101 | $106,996 | — |
Most Expensive
79119 — $380,329. The priciest ZIP in Amarillo, roughly 84% above the city median, with rent at $1,665 suggesting larger, newer single-family housing stock.
79124 — $373,436. Nearly tied with 79119 at the top, running about 81% over the citywide median.
79121 — $292,555. A step down from the top two but still 42% above the median, positioning it as mid-to-high Amarillo.
Most Affordable
79101 — $106,996. The downtown core and cheapest ZIP in the city, priced 48% below the Amarillo median.
79107 — $108,581. Almost identical to 79101, with rent of $1,062 — meaning monthly rent is roughly 12% of the home’s annual value, a high ratio that favors buying for anyone planning to stay.
79104 — $112,538. Just above 79107, again roughly half the citywide median and a fraction of the cost of homes on the south side.
Rent vs Buy in Amarillo
Rent data is available for six Amarillo ZIPs. The figures range from $934 in 79106 to $1,728 in 79118. The mean across those six areas is about $1,331 per month.
Compare that to the math of buying the median-priced home at $206,462. With 20% down ($41,292) and a $165,170 loan at a 7% 30-year mortgage rate, principal and interest run about $1,099 per month. Add property taxes — Texas averages near 1.8% of assessed value — and you’re at another $310 per month. Insurance adds roughly $100. Total monthly carrying cost: about $1,509.
So on paper, renting the average unit is cheaper by roughly $175 per month. But the comparison shifts by ZIP.
In 79106, rent is $934 and homes typically sell for $161,872. A mortgage on that home with 20% down works out to around $1,200 all-in. Renting wins clearly there.
In 79119, rent is $1,665. A mortgage on the $380,329 typical home? Around $2,780 with taxes and insurance. Renting wins by over $1,000 a month.
The story flips in cheaper ZIPs without public rent data. A $107,000 home in 79101 carries a total monthly cost near $800. Any renter paying $900+ in that area would save money by buying, assuming they have a down payment.
Shorter-term renters should rent. Anyone planning to stay five years or more in a cheap ZIP should run the numbers on buying.
Population Growth and Migration
Amarillo is growing, just slowly. The city added 3,162 residents between 2020 and 2024, a 1.6% gain over four years.
| Year | Population |
|---|---|
| 2020 | 200,567 |
| 2021 | 200,825 |
| 2022 | 201,475 |
| 2023 | 202,734 |
| 2024 | 203,729 |
Each year posted a gain, and the pace picked up slightly after 2022. This is not boomtown growth. It’s also not decline.
Here’s how Amarillo compares to other Texas cities:
| City | 2024 Population | 4-Year Growth |
|---|---|---|
| Houston | 2,390,125 | +4.0% |
| San Antonio | 1,526,656 | +6.1% |
| Fort Worth | 1,008,106 | +9.1% |
| Austin | 993,588 | +2.9% |
| Lubbock | 272,086 | +5.4% |
| Amarillo | 203,729 | +1.6% |
Amarillo’s growth rate is the slowest among those six. Lubbock, the closest peer in size and region, grew more than three times faster. Fort Worth, about five hours east, grew almost six times as fast.
What does that mean for housing? Demand is positive but gentle. Supply pressure from new residents isn’t driving prices — which explains the calm 1.9% annual appreciation. If you’re buying in Amarillo, you’re not racing migration waves. You’re buying into a stable, locally-driven market.
Amarillo Housing Market Trends
| Month | Median Value | Low | High |
|---|---|---|---|
| Feb 2026 | $206,462 | $106,996 | $380,329 |
| Jan 2026 | $205,696 | $106,696 | $379,359 |
| Dec 2025 | $204,678 | $106,290 | $378,407 |
| Nov 2025 | $203,768 | $106,087 | $377,122 |
| Oct 2025 | $203,023 | $105,809 | $375,628 |
| Sep 2025 | $202,579 | $105,805 | $374,487 |
| Aug 2025 | $202,304 | $105,344 | $373,939 |
| Jul 2025 | $202,191 | $105,025 | $373,924 |
| Jun 2025 | $202,114 | $105,031 | $373,774 |
| May 2025 | $202,103 | $105,553 | $373,596 |
| Apr 2025 | $202,267 | $106,058 | $373,915 |
| Mar 2025 | $202,552 | $106,238 | $374,712 |
The trend is one-directional. Prices bottomed in May 2025 at $202,103 and have risen every month since. The 9-month gain is $4,359, or roughly $484 per month.
The rate of increase has accelerated. From March to August 2025, the median moved just $248 — essentially flat. From August to February, it moved another $4,158. That’s a clear inflection point in the fall of 2025.
The high end is climbing faster than the low end in dollar terms. The top of the range went from $374,712 in March 2025 to $380,329 in February 2026, a $5,617 gain. The bottom barely moved, going from $106,238 to $106,996.
You’re looking at a market where premium homes are appreciating and entry-level homes are stuck. That’s a small but meaningful signal for first-time buyers: the floor isn’t rising quickly. Waiting a few months won’t price you out of cheaper ZIPs.
Is Amarillo a Good Place to Buy in 2026?
The data points to a balanced market leaning slightly toward sellers. Prices are rising, but slowly. No ZIP is falling. Supply appears to be meeting demand.
For buyers, three things stand out:
First, affordability is real. A $206K median puts Amarillo below most Texas metros and well below the U.S. average. Your mortgage dollar goes further here.
Second, appreciation is modest. If you’re buying for investment return, 1.9% a year won’t beat inflation. If you’re buying to live, that same stability protects you from downside.
Third, the neighborhood you choose matters more than in most cities. Picking 79101 versus 79119 is a 3.5x difference in purchase price. Rent yields also diverge sharply by ZIP.
For sellers, the slow rise makes pricing tricky. The 9-month run of gains suggests buyers are accepting higher asks — but only gradually. Aggressive pricing above recent comps may sit.
Amarillo Housing Market Outlook for 2026-2027
The 3-month trend suggests continued slow appreciation. Monthly gains averaged $895 between November 2025 and February 2026 — a higher pace than earlier in 2025.
If the current pace continues through spring 2026, the median would land somewhere in the $208K–$210K range by mid-year. That’s not a forecast with any certainty, but it’s what the recent momentum implies.
The top end is showing faster movement than the bottom, which means premium neighborhoods like 79119 and 79124 may push further above $385K. Entry-level ZIPs like 79101 and 79107 have been nearly flat for a year and could stay that way.
Amarillo’s slow 1.6% four-year population growth argues against a sudden surge in demand. No migration wave is coming. The market is driven by local buyers, local incomes, and local supply. That makes sharp price moves in either direction unlikely over the next six months.
Similar Markets in TX
If Amarillo’s price range interests you, a few other Texas cities warrant a look:
- El Paso — Another affordable Texas metro, often compared to Amarillo for buyers who want low entry prices in a mid-size city.
- Brownsville — South Texas alternative with a similar budget profile for first-time buyers.
- San Antonio — Bigger metro with more job density, though prices run higher per square foot.
- Houston — Much larger market; useful as a benchmark for just how much cheaper Amarillo really is.
- Dallas — The Texas reference point for premium pricing — Amarillo is a fraction of the cost.
Frequently Asked Questions
What is the average home price in Amarillo?
The average home price in Amarillo, TX is $206,462 as of February 2026. That’s the typical value across the city’s 13 tracked ZIP codes, with individual neighborhoods ranging from $106,996 to $380,329.
Are home prices going up or down in Amarillo?
Prices are up 1.9% year over year. The median has risen every month since May 2025, climbing from $202,103 to $206,462 — a $4,359 gain over nine months, with the pace accelerating in late 2025.
Is it cheaper to rent or buy in Amarillo?
On the median home, renting is slightly cheaper month-to-month: around $1,331 in rent versus an estimated $1,509 total monthly cost to own. But the math flips in cheap ZIPs like 79101, where buying beats renting for anyone staying more than a few years.
What is the most affordable neighborhood in Amarillo?
ZIP 79101, covering downtown Amarillo, has the lowest typical home value at $106,996 — roughly half the citywide median. ZIPs 79107 ($108,581) and 79104 ($112,538) round out the three cheapest.
Methodology
Home values are based on the Zillow Home Value Index (ZHVI), a smoothed measure of typical home values in the 35th to 65th percentile range. Rent estimates use the Zillow Observed Rent Index (ZORI). Population figures come from the U.S. Census Bureau Population Estimates Program (2020-2024 vintage). All datasets are publicly available. Housing data updated 2026-02-28.