Beaumont Home Prices: $164K, Up 1.7% — 8 ZIPs Analyzed (2026)
$164,118. That’s what a typical home costs in Beaumont, TX as of February 2026. Prices are up 1.7% from a year ago, and the market has posted gains for seven straight months.
Quick answer: The average home price in Beaumont, TX is $164,118 as of February 2026, up 1.7% year over year.
Current Home Prices in Beaumont
The citywide median sits at $164,118. That covers eight ZIP codes inside Beaumont, spanning a wide range from entry-level homes under $100K to larger properties above $250K.
Here’s the snapshot:
| Metric | Value |
|---|---|
| Median home value | $164,118 |
| Year-over-year change | +1.7% |
| Cheapest ZIP | $92,295 (77703) |
| Most expensive ZIP | $253,610 (77713) |
| Price spread | $161,315 |
| ZIP codes tracked | 8 |
| Data through | February 2026 |
The gap between the cheapest and priciest ZIP is $161,315. That’s nearly as much as the citywide median itself. So “the Beaumont market” depends heavily on which part of town you’re looking at.
A 1.7% annual gain is modest. It trails broader Texas metros like Houston and San Antonio, and it trails inflation. In real terms, Beaumont homeowners have treaded water over the past twelve months.
But direction matters. Prices bottomed at $159,340 in July 2025. Since then the median has added roughly $4,800. That’s a 3% pickup in seven months, an annualized pace of about 5% if it holds.
The flip side: Beaumont remains one of the more affordable metros in Texas. $164K buys a single-family home here. In Austin, the same budget barely covers a small condo.
Beaumont Home Prices by Neighborhood
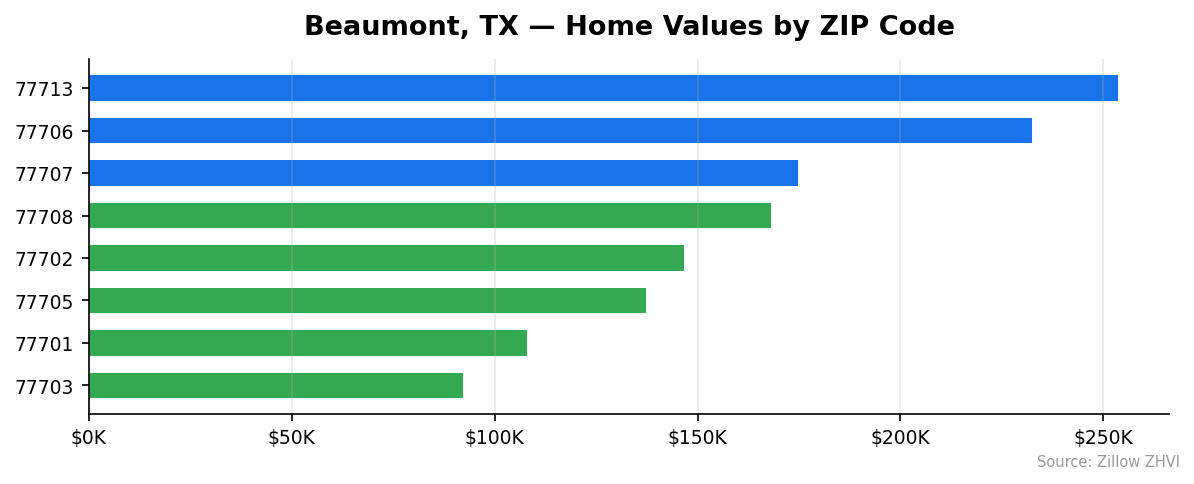
Eight ZIPs, eight very different markets. Here’s the full breakdown:
| ZIP | Median Home Value | Median Rent | Vs City Median |
|---|---|---|---|
| 77713 | $253,610 | $1,317 | +55% |
| 77706 | $232,312 | $1,442 | +42% |
| 77707 | $174,684 | — | +6% |
| 77708 | $167,999 | — | +2% |
| 77702 | $146,686 | — | -11% |
| 77705 | $137,280 | $1,115 | -16% |
| 77701 | $108,079 | $928 | -34% |
| 77703 | $92,295 | $1,197 | -44% |
Most Expensive
77713 tops the list at $253,610, about 55% above the city median, with rent at $1,317.
77706 comes next at $232,312 and the highest rent in town at $1,442, signaling steady renter demand in that area.
77707 rounds out the top three at $174,684, a step down but still above the citywide average.
Most Affordable
77703 is the cheapest ZIP at $92,295 — under $100K. Rent there averages $1,197, which is notably higher than the home value would suggest.
77701 sits at $108,079 with the lowest rent in the dataset, $928.
77705 rounds out the bottom three at $137,280, with rent of $1,115.
The rent figures tell a separate story. In 77703, rent is 73% above what you might expect given the home values. That’s a strong signal that buying could beat renting for tenants who can qualify for a mortgage.
Rent vs Buy in Beaumont
Rent data is available for five of Beaumont’s eight ZIPs. The average monthly rent across those ZIPs is roughly $1,199.
| Scenario | Monthly Cost (approx.) |
|---|---|
| Average rent (5 ZIPs) | $1,199 |
| Mortgage on $164,118 (20% down, 7% rate) | ~$873 P&I |
| Add taxes and insurance | ~$1,100–$1,300 total |
On paper, owning looks competitive with renting at the median price point. The monthly math tilts toward buying if you plan to stay five-plus years. If you’re mobile or short on a down payment, renting remains the cheaper option.
The math gets more interesting at the low end. A home in 77703 at $92,295 would carry a mortgage of about $492 principal and interest with 20% down. Add taxes and insurance and you’re probably at $700 to $800 monthly — well below the $1,197 rent figure in the same ZIP.
At the high end it flips. A $253,610 home in 77713 pencils out at about $1,350 P&I, or $1,700 to $1,900 all in. That’s more than the $1,317 rent there.
So the rent-vs-buy answer in Beaumont depends on your ZIP, your down payment, and your time horizon. There’s no single citywide verdict.
Population Growth and Migration
Beaumont is losing people. The city had 114,879 residents in 2020. By 2024 that number had dropped to 112,893, a 4-year decline of 1.7%.
| Year | Population |
|---|---|
| 2020 | 114,879 |
| 2021 | 113,642 |
| 2022 | 112,516 |
| 2023 | 112,616 |
| 2024 | 112,893 |
The slide stopped in 2023. Population has edged up slightly for two straight years, though it remains below the 2020 figure.
Compare that to other Texas cities:
| City | 2024 Population | 4-Year Growth |
|---|---|---|
| Fort Worth | 1,008,106 | +9.1% |
| San Antonio | 1,526,656 | +6.1% |
| Lubbock | 272,086 | +5.4% |
| Houston | 2,390,125 | +4.0% |
| Austin | 993,588 | +2.9% |
| Beaumont | 112,893 | -1.7% |
Every major Texas metro added residents. Beaumont shed them. That shapes housing demand in an obvious way: fewer new buyers compete for homes, which caps price appreciation. It also helps explain why Beaumont’s 1.7% annual price gain lags the state.
The recent bottoming of population losses is worth watching. If the small 2023-to-2024 recovery turns into steady growth, housing demand could firm up from here.
Beaumont Housing Market Trends
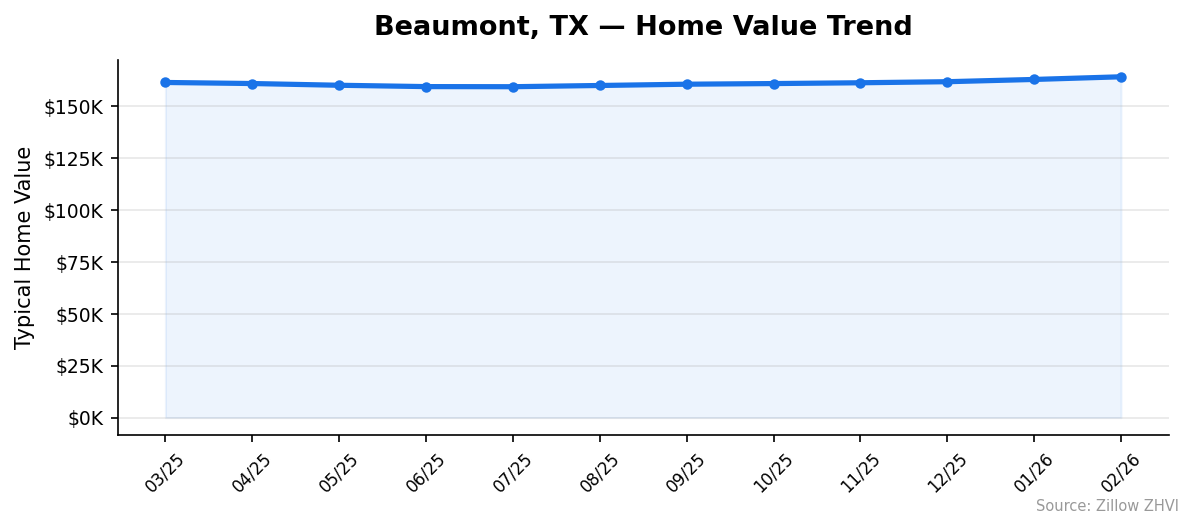
The 12-month trend shows a V-shaped recovery.
| Month | Median |
|---|---|
| March 2025 | $161,382 |
| April 2025 | $160,871 |
| May 2025 | $160,036 |
| June 2025 | $159,393 |
| July 2025 | $159,340 |
| August 2025 | $159,930 |
| September 2025 | $160,545 |
| October 2025 | $160,856 |
| November 2025 | $161,238 |
| December 2025 | $161,751 |
| January 2026 | $162,838 |
| February 2026 | $164,118 |
Prices slid for four straight months from March through July 2025, bottoming at $159,340. Then the market turned. Every month since has posted a gain.
The three most recent months — December, January, February — show the fastest pace of the year, each adding more than the prior. February alone added $1,280.
That’s a shift in character. For most of 2025 Beaumont looked like a flat or softening market. The 2026 data so far points to something firmer.
Is Beaumont a Good Place to Buy in 2026?
The data points to a slightly more favorable environment for buyers than a year ago, though that window may be closing.
Prices bottomed seven months ago. They’re still below the 2025 peak in some ZIPs, and affordability remains strong — Beaumont’s median is well under half the Texas big-city average. A $164K home at current rates is reachable on a median household income.
What should give a buyer pause is the population data. Beaumont is still smaller than it was in 2020. Slow or flat population means weaker demand, which means weaker appreciation. If you’re buying as an investment, that’s a real headwind.
If you’re buying to live in the home for a decade, the math works. Your monthly cost at the median price competes with rent, and you’ll build equity either way. If you’re buying on a three-year horizon expecting to flip, the 1.7% annual appreciation rate is a warning sign.
Beaumont Housing Market Outlook for 2026-2027
The 3-month trend suggests accelerating, not slowing, price growth. Prices have added $2,367 since November 2025, with each month’s gain larger than the last.
If the current pace continues into summer, Beaumont could cross $170K by late 2026. That would mark the strongest stretch of appreciation since tracking began in this dataset.
What could stop it: the slow population base. Beaumont doesn’t have the in-migration story that’s driving Austin or San Antonio. Price gains here depend on existing residents trading up or first-time buyers entering the market, not a flood of newcomers.
A slowdown is just as plausible as a continued climb. The July 2025 bottom was only nine months ago, and the market has a recent history of rolling over.
Similar Markets in TX
If Beaumont’s price point or pace doesn’t fit your search, these Texas cities offer different profiles:
- Brownsville — another affordable Gulf-region market worth comparing if you want similar price points.
- El Paso — mid-sized Texas city with its own distinct pricing dynamics.
- Houston — the nearest major metro, offering more inventory and job growth at higher prices.
- San Antonio — a much larger market with stronger population gains.
- Edinburg — worth a look if affordability plus growth is your priority.
Frequently Asked Questions
What is the average home price in Beaumont?
The average home price in Beaumont, TX is $164,118 as of February 2026. That’s the median across eight ZIP codes, with individual neighborhoods ranging from $92,295 to $253,610.
Are home prices going up or down in Beaumont?
Prices are up 1.7% year over year. The market bottomed at $159,340 in July 2025 and has gained every month since, with the recent pace accelerating into early 2026.
Is it cheaper to rent or buy in Beaumont?
It depends on the ZIP. Average rent runs about $1,199, while a mortgage on the median $164,118 home comes in at roughly $1,100 to $1,300 all in with 20% down. Buying pencils out better in cheaper ZIPs like 77703, while renting is cheaper in higher-priced areas like 77713.
What is the most affordable neighborhood in Beaumont?
ZIP 77703 is the cheapest, with a typical home value of $92,295 — 44% below the city median. Rent there averages $1,197, which means buyers may find stronger value than renters in that specific ZIP.
Methodology
Home values are based on the Zillow Home Value Index (ZHVI), a smoothed measure of typical home values in the 35th to 65th percentile range. Rent estimates use the Zillow Observed Rent Index (ZORI). Population figures come from the U.S. Census Bureau Population Estimates Program (2020-2024 vintage). All datasets are publicly available. Housing data updated 2026-02-28.