Temple Home Prices: $244K, Down 3.5% — 4 ZIPs Analyzed (2026)
$244,114. That’s the average home price in Temple, TX as of February 2026, down 3.5% from a year earlier. The city has logged price drops for most of the past 12 months, but the decline has slowed since December.
Quick answer: The average home price in Temple, TX is $244,114 as of February 2026, down 3.5% year over year according to Zillow.
Current Home Prices in Temple
The typical Temple home sold for $244,114 in February 2026. A year earlier, the figure stood near $252,979. That’s a loss of roughly $8,865 on a typical home — the kind of number that matters if you bought in early 2025 hoping for appreciation.
The gap between the cheapest and priciest neighborhoods is wide. The low end of the city sits at $186,540. The top end reaches $324,173. That’s a 74% spread between the most affordable and most expensive ZIP codes tracked here.
| Metric | Value |
|---|---|
| Median home value | $244,114 |
| Year-over-year change | -3.5% |
| Lowest ZIP average | $186,540 |
| Highest ZIP average | $324,173 |
| ZIP codes tracked | 4 |
| Metro area | Killeen-Temple, TX |
| Data through | February 2026 |
Temple sits roughly between Austin and Waco along I-35. Prices here run well under Austin levels. Austin’s housing market carries a median near the upper-$500K range, meaning Temple costs less than half as much per typical home. For Central Texas buyers priced out of the capital, that’s the draw.
The 3.5% annual decline is also shallower than what some larger Texas metros have posted. And the monthly data shows prices ticking up slightly in early 2026 after bottoming out in December.
Temple Home Prices by Neighborhood
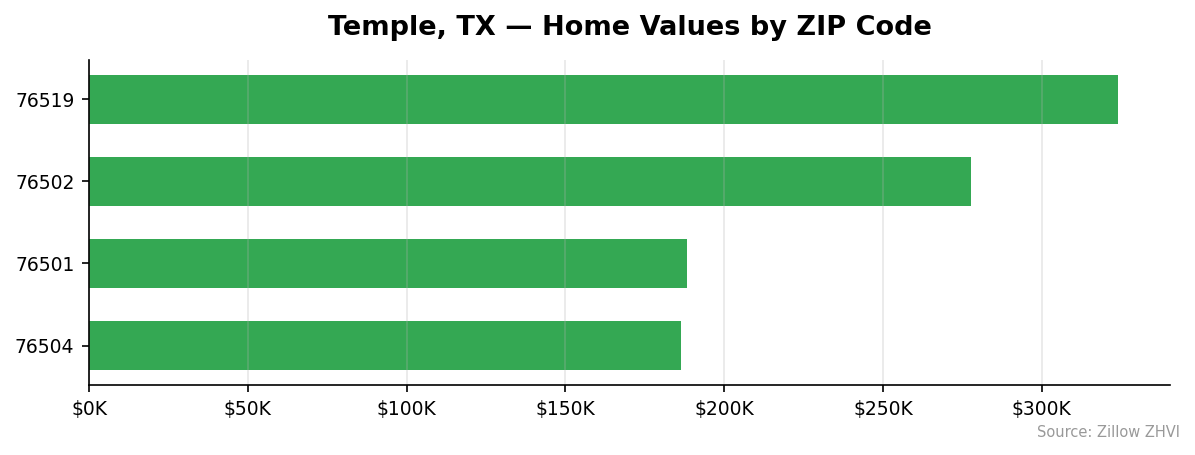
Temple has four tracked ZIP codes. Prices range from under $190K to over $320K depending on where you look.
| ZIP Code | Average Home Value | Avg Monthly Rent |
|---|---|---|
| 76519 | $324,173 | Data not available |
| 76502 | $277,591 | $1,557 |
| 76501 | $188,152 | $1,345 |
| 76504 | $186,540 | $1,284 |
Most Expensive
76519 tops the list at $324,173. That’s 33% above the city average and the only Temple ZIP pushing past the $300K mark.
76502 comes in second at $277,591. It runs about 14% above the city median, and rents there average $1,557 — the highest of any Temple ZIP with rent data.
Most Affordable
76504 is the cheapest ZIP at $186,540. Rent averages $1,284 here, also the lowest in the city. You get 24% below the median price.
76501 sits just above at $188,152 with rent near $1,345. It’s essentially tied with 76504 on price but rents about $61 more per month on average.
Rent vs Buy in Temple
Renting is cheaper right now if you’re looking at monthly cash out the door. Across the three ZIPs with rent data, tenants pay an average of about $1,395 per month.
Buying looks different. A $244,114 home with 20% down ($48,823) leaves a loan near $195,291. At a 7% 30-year rate, principal and interest alone runs roughly $1,299 per month. Add property taxes, insurance, and HOA fees where they apply, and the realistic all-in monthly cost pushes past $1,600.
| Scenario | Monthly Cost (est.) |
|---|---|
| Average rent (3-ZIP avg) | $1,395 |
| Mortgage P&I only, 20% down at 7% | ~$1,299 |
| Mortgage with taxes and insurance | ~$1,600+ |
The comparison gets more interesting by ZIP. In 76504, rent averages $1,284 and the typical home costs $186,540. That mortgage at the same terms works out to roughly $1,000 in P&I, meaning buying could match or beat renting month-to-month if taxes are moderate.
In 76502, the calculation flips. Rent is $1,557 and homes average $277,591. The mortgage runs closer to $1,475 in P&I — still below rent, but the down payment on a $277K home is $55K, a real hurdle.
The verdict: if you have the down payment, buying in the cheaper ZIPs can undercut renting. If you don’t, renting wins without contest.
Population Growth and Migration
Temple grew fast. The Census Bureau pegged the city at 82,799 residents in 2020 and 96,267 in 2024. That’s a 16.3% gain in four years, or roughly 3,400 new residents every year.
| Year | Population |
|---|---|
| 2020 | 82,799 |
| 2021 | 85,783 |
| 2022 | 89,724 |
| 2023 | 93,332 |
| 2024 | 96,267 |
Here’s what makes that number stand out: Temple is growing faster than every major Texas city in percentage terms.
| City | 2024 Population | 4-Year Growth |
|---|---|---|
| Temple | 96,267 | +16.3% |
| Fort Worth | 1,008,106 | +9.1% |
| San Antonio | 1,526,656 | +6.1% |
| Lubbock | 272,086 | +5.4% |
| Houston | 2,390,125 | +4.0% |
| Austin | 993,588 | +2.9% |
Fort Worth — the next fastest grower on this list — added residents at barely more than half Temple’s rate. Austin, long the poster child for Texas population booms, trailed Temple by more than 13 percentage points.
For housing, steady migration usually supports demand. Yet Temple prices still fell 3.5% this year. That tells you new supply is arriving fast enough to offset buyer interest, or that affordability ceilings have been tested and mortgage rates are pushing back against growth.
Temple Housing Market Trends
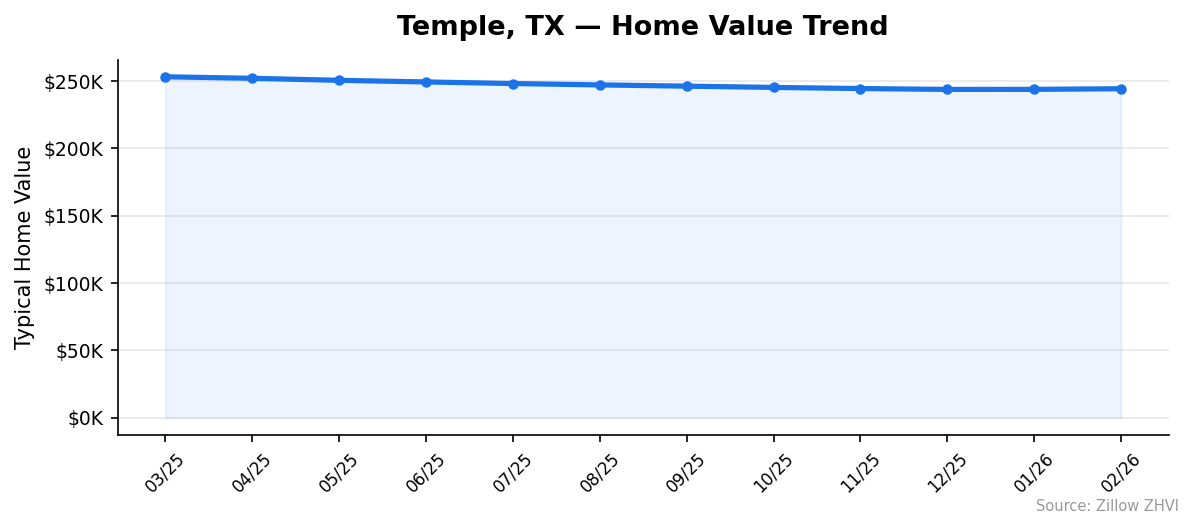
The 12-month price path shows a clear slide followed by a flattening. Prices peaked in March 2025 at $252,979 and fell nearly every month through late 2025. Since December, they’ve stabilized.
| Month | Average Price |
|---|---|
| Mar 2025 | $252,979 |
| Apr 2025 | $251,855 |
| May 2025 | $250,352 |
| Jun 2025 | $249,154 |
| Jul 2025 | $247,962 |
| Aug 2025 | $246,957 |
| Sep 2025 | $246,023 |
| Oct 2025 | $245,094 |
| Nov 2025 | $244,247 |
| Dec 2025 | $243,610 |
| Jan 2026 | $243,657 |
| Feb 2026 | $244,114 |
The drop from March to December totaled $9,369 — a steady monthly bleed of roughly $1,000. Then December hit the floor. January added $47. February added another $457.
Two months of small gains don’t make a recovery. But they do break the pattern. If prices continue their slow climb through spring selling season, Temple could close 2026 flat rather than down.
Is Temple a Good Place to Buy in 2026?
The data points to a buyer’s market that’s cooling. Prices are down 3.5% year over year. Inventory pressure has been strong enough to push the typical home value down for most of the past year. Sellers have had less bargaining power than they’ve been used to.
On the buyer side, the math is friendlier than it was in 2024. A $244K median in a growing city with strong Census numbers is a reasonable entry point by Texas standards. Temple’s 16.3% population growth over four years means the long-term demand picture looks solid even if short-term prices are soft.
The caveat: mortgage rates near 7% still weigh heavily on affordability. The monthly payment on a typical Temple home runs close to or above local rents. If you plan to stay put for five-plus years, the price discount and population growth argue for buying now. If you might move in two years, renting is the safer play.
Temple Housing Market Outlook for 2026-2027
The 3-month trend suggests stabilization. December’s $243,610 was the low. January and February each posted small gains, bringing prices back to $244,114.
If the current pace continues, Temple could see flat-to-slightly-positive prices through the summer. A full reversal to 2024 highs isn’t in sight — prices would need to rise roughly $9K to recover the annual loss. That kind of move usually requires either a rate cut or a supply shock.
Population inflows of 3,000+ per year provide a floor. Without them, the 9-month decline could have run deeper. Watch the spring months. If prices climb through April and May, buyers return with confidence. If they fall again, the bottom wasn’t actually hit in December.
Similar Markets in TX
- Houston — The state’s largest city, with metro prices generally higher than Temple and slower population growth.
- San Antonio — Another mid-priced Texas market worth comparing if you want a bigger city at a similar price tier.
- Dallas — Higher prices than Temple, but Dallas-Fort Worth commuters sometimes consider Central Texas alternatives.
- Katy — A Houston-area suburb with a family-oriented market. Useful if you’re weighing small-city Temple against suburban Houston.
- Sugar Land — A pricier Houston suburb for buyers willing to spend more than Temple’s median for bigger-metro amenities.
Frequently Asked Questions
What is the average home price in Temple?
The average home price in Temple, TX is $244,114 as of February 2026. That figure comes from the Zillow Home Value Index, which tracks typical home values between the 35th and 65th percentiles. The range across Temple ZIPs runs from $186,540 to $324,173.
Are home prices going up or down in Temple?
Prices are down 3.5% year over year, falling from about $252,979 in March 2025. The monthly trend shows steady declines through late 2025 followed by two months of small gains in January and February 2026. The price floor so far was $243,610 in December.
Is it cheaper to rent or buy in Temple?
Renting is cheaper month-to-month in most ZIPs. The average rent runs about $1,395 while a mortgage on the median $244K home — including taxes and insurance — lands closer to $1,600 per month with 20% down. In 76504, the cheapest ZIP, buying can come out ahead if you have the down payment.
What is the most affordable neighborhood in Temple?
ZIP 76504 has the lowest average home value at $186,540, 24% below the city median. ZIP 76501 sits just $1,612 higher at $188,152. Rents in both ZIPs run under $1,350 per month.
Methodology
Home values are based on the Zillow Home Value Index (ZHVI), a smoothed measure of typical home values in the 35th to 65th percentile range. Rent estimates use the Zillow Observed Rent Index (ZORI). Population figures come from the U.S. Census Bureau Population Estimates Program (2020-2024 vintage). All datasets are publicly available. Housing data updated 2026-02-28.