Corpus Christi Home Prices: $173K, Down 2.8% — 16 ZIPs (2026)
$173,246. That is what a typical home in Corpus Christi costs right now. Prices are down 2.8% from a year ago, and the market has been moving sideways for months.
Quick answer: The average home price in Corpus Christi, TX is $173,246 as of February 2026, down 2.8% year over year according to Zillow.
Current Home Prices in Corpus Christi
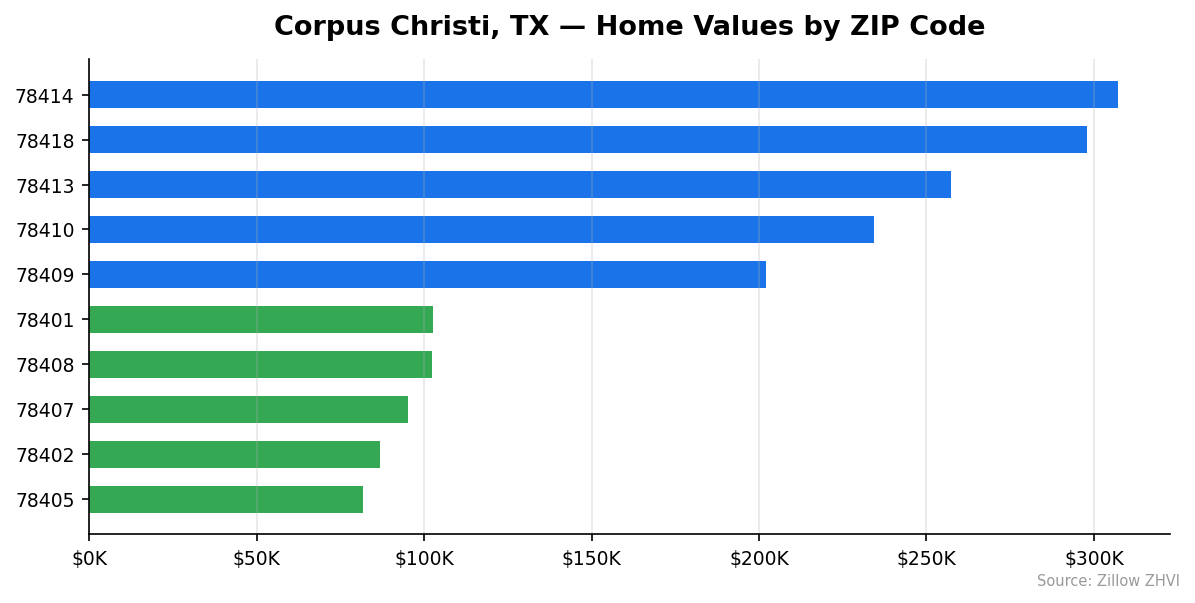
The typical Corpus Christi home sits well below the Texas average and far below big-metro neighbors like Austin or Dallas. Values across 16 tracked ZIP codes range from $81,775 at the low end to $307,288 at the top — a nearly 4x spread inside city limits.
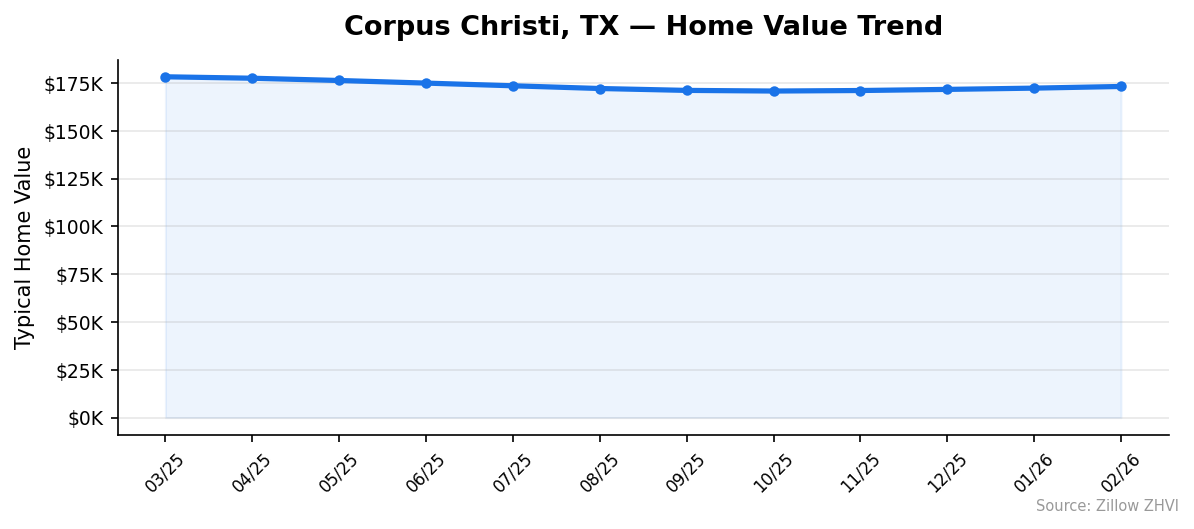
The city peaked at around $178,309 in March 2025. It then slid for seven straight months before stabilizing. February 2026 values are up from the October trough but still below last spring.
| Metric | Value |
|---|---|
| Median home value | $173,246 |
| Year-over-year change | -2.8% |
| Lowest ZIP median | $81,775 |
| Highest ZIP median | $307,288 |
| ZIP codes tracked | 16 |
| Data as of | February 2026 |
A 2.8% annual drop is modest compared to some Texas markets — Austin has seen sharper corrections — but it reverses years of gains. If you bought at the 2025 peak, you are underwater on paper. If you are shopping now, you have more room to negotiate than buyers did 12 months ago.
The price range inside Corpus Christi matters more than the headline median. A $173K average hides ZIPs where typical homes cost less than $100K and others pushing past $300K. Which part of the city you buy in decides almost everything about your monthly payment.
Corpus Christi Home Prices by Neighborhood
| ZIP Code | Typical Home Value |
|---|---|
| 78414 | $307,288 |
| 78418 | $297,835 |
| 78413 | $257,301 |
| 78410 | $234,427 |
| 78409 | $202,143 |
| 78417 | $191,355 |
| 78412 | $190,782 |
| 78411 | $188,532 |
| 78415 | $172,764 |
| 78404 | $153,504 |
| 78416 | $107,238 |
| 78401 | $102,525 |
| 78408 | $102,311 |
| 78407 | $95,240 |
| 78402 | $86,917 |
| 78405 | $81,775 |
Most Expensive
78414 — $307,288. The priciest ZIP sits 77% above the city median, with average rents around $1,673. Homes here are newer and larger than the city norm.
78418 — $297,835. Island-adjacent and coastal, this ZIP has the highest average rent at $1,863 — a premium tied to waterfront access.
78413 — $257,301. Solidly above median at 49% more than the city average. Notably, rents here ($1,154) run well below 78414, suggesting more owner-occupancy.
Most Affordable
78405 — $81,775. The cheapest ZIP in Corpus Christi, at 53% below median. Older housing stock and smaller lots.
78402 — $86,917. Half the city-wide typical price. No rent data is tracked here.
78407 — $95,240. The third-cheapest ZIP, where a typical home costs roughly one-third of a 78414 property.
Rent vs Buy in Corpus Christi
Rent data covers 9 of the 16 Corpus Christi ZIPs tracked. Average rent across those areas is about $1,487 per month. The highest is 78418 at $1,863; the lowest with data is 78413 at $1,154.
Here is the monthly math on a median-priced home:
| Cost Component | Monthly |
|---|---|
| Principal & interest (20% down, 7%, 30-yr) | $922 |
| Property tax (~2.5% annual) | $361 |
| Insurance | $150 |
| Total ownership cost | ~$1,433 |
That math says a median buyer pays about $54 less per month than the average renter in a tracked ZIP. But ownership requires $34,649 up front for a 20% down payment, plus closing costs.
Renting wins if you plan to leave within 3 years or cannot absorb a repair bill. Buying wins if you stay put — Texas property taxes are high, but you are building equity and locking in your housing cost. Insurance on the Gulf Coast runs more than in inland Texas, which narrows the gap.
The break-even stretches in ZIPs where rent is low relative to price. In 78413, rent is $1,154 while the typical home costs $257,301 — there, renting is clearly cheaper month to month.
Population Growth and Migration
Corpus Christi is losing people. The city had 318,285 residents in 2020 and 317,317 in 2024 — a 0.3% decline over four years.
| Year | Population |
|---|---|
| 2020 | 318,285 |
| 2021 | 318,162 |
| 2022 | 316,441 |
| 2023 | 316,978 |
| 2024 | 317,317 |
The bottom was 2022. The city has regained some residents since, but remains below its 2020 count. Compare that with other Texas cities:
| City | 2024 Population | 4-Year Growth |
|---|---|---|
| Fort Worth | 1,008,106 | +9.1% |
| San Antonio | 1,526,656 | +6.1% |
| Lubbock | 272,086 | +5.4% |
| Houston | 2,390,125 | +4.0% |
| Austin | 993,588 | +2.9% |
| Corpus Christi | 317,317 | -0.3% |
Every comparable Texas city grew. Corpus Christi shrank. That matters for housing because flat or declining population limits buyer demand, which helps explain why prices here fell 2.8% while some growing Texas markets held up better. For buyers, weak demand means more negotiating room. For sellers, it means longer days on market.
Corpus Christi Housing Market Trends
| Month | Typical Value |
|---|---|
| Feb 2026 | $173,246 |
| Jan 2026 | $172,373 |
| Dec 2025 | $171,713 |
| Nov 2025 | $171,125 |
| Oct 2025 | $170,854 |
| Sep 2025 | $171,189 |
| Aug 2025 | $172,179 |
| Jul 2025 | $173,599 |
| Jun 2025 | $175,005 |
| May 2025 | $176,371 |
| Apr 2025 | $177,556 |
| Mar 2025 | $178,309 |
The 12-month pattern shows a clean decline from March 2025 through October 2025, followed by four straight months of small gains. Values fell $7,455 — or 4.2% — from peak to trough. They have recovered $2,392 of that since October.
The trend has turned, but slowly. Each monthly uptick has been under 1%.
Is Corpus Christi a Good Place to Buy in 2026?
The data points to a buyer-friendly market. Prices are down 2.8% year over year. Population is flat. The most expensive ZIP costs under $310K — affordable by Texas standards.
You have options here. A $100K home is still possible in four ZIPs. A $200K budget puts you in solid mid-tier areas like 78411 or 78412. Coastal ZIP 78418 runs under $300K and offers higher rent yields if you are thinking about a rental.
The downsides: population decline means you are buying in a market without demand tailwinds. Gulf Coast insurance is expensive. Property taxes in Texas are high across the board.
If you plan to live in the home 5+ years and can stomach coastal insurance costs, the math works. If you need strong appreciation to justify the purchase, look at growing Texas cities instead. The 2.8% annual drop is a warning that this market is not a price-growth bet.
Corpus Christi Housing Market Outlook for 2026-2027
The 3-month trend suggests prices are stabilizing. Values rose in each of the last four months after a seven-month slide.
If the current pace continues, Corpus Christi could recover most of its 2025 losses within 12 months — but that assumes the momentum from late 2025 holds. The monthly gains have been small, under $900 per month on average.
Watch whether population turns upward. The city added residents in 2023 and 2024 after losing them earlier. Another year of growth would support the housing recovery. Another flat or negative year would cap price gains.
Coastal markets also face insurance-rate pressure. If carriers raise premiums further, affordability declines even if prices hold steady.
Similar Markets in TX
- Brownsville — another Gulf Coast Texas city with similar affordability and smaller-metro dynamics.
- San Antonio — bigger market, higher prices, stronger population growth.
- El Paso — comparable size and budget range for buyers priced out of larger Texas metros.
- Edinburg — South Texas market with similar population profile.
- Houston — for buyers willing to trade affordability for job market size.
Frequently Asked Questions
What is the average home price in Corpus Christi?
The typical home in Corpus Christi is worth $173,246 as of February 2026. That is well below the Texas statewide average and reflects a small, mostly stable coastal market.
Are home prices going up or down in Corpus Christi?
Prices are down 2.8% year over year. The market bottomed in October 2025 at $170,854 and has gained about $2,400 since, so the short-term direction is modestly positive even though the annual comparison is negative.
Is it cheaper to rent or buy in Corpus Christi?
Owning a median-priced home runs about $1,433 per month with 20% down, a 7% mortgage, and Texas property taxes and insurance. Average rent in tracked ZIPs is roughly $1,487, so buying is slightly cheaper monthly — but requires about $35K up front.
What is the most affordable neighborhood in Corpus Christi?
ZIP 78405 is the cheapest at $81,775 — less than half the citywide median. 78402 ($86,917) and 78407 ($95,240) are the next two most affordable areas.
Methodology
Home values are based on the Zillow Home Value Index (ZHVI), a smoothed measure of typical home values in the 35th to 65th percentile range. Rent estimates use the Zillow Observed Rent Index (ZORI). Population figures come from the U.S. Census Bureau Population Estimates Program (2020-2024 vintage). All datasets are publicly available. Housing data updated 2026-02-28.