Fort Myers Home Prices: $307K, Down 9.4% — 10 ZIPs Analyzed (2026)
Prices dropped for the twelfth month in a row. Fort Myers home values now sit at $306,813, down 9.4% from this time last year. The city is one of the steepest correctors in Florida.
Quick answer: The average home price in Fort Myers, FL is $306,813 as of February 2026, down 9.4% year over year according to Zillow.
Current Home Prices in Fort Myers
The typical Fort Myers home is worth $306,813. A year ago, it was worth roughly $338,800. That’s a $32,000 paper loss for the average homeowner.
The drop has been consistent. Every single month over the last twelve has come in lower than the one before. There’s no sign of a bottom in the recent data.
| Metric | Value |
|---|---|
| Median home value | $306,813 |
| Year-over-year change | -9.4% |
| Cheapest ZIP | $207,705 |
| Most expensive ZIP | $444,002 |
| Price spread | $236,297 |
| ZIP codes tracked | 10 |
| Data through | February 2026 |
The spread between the cheapest and priciest ZIP is wide. The most expensive area costs more than twice the cheapest one. That gap is unusual for a mid-sized city and tells you Fort Myers is really several markets stacked on top of each other.
For context, the metro area is officially Cape Coral-Fort Myers. Lee County took a heavy beating from Hurricane Ian in 2022, and the price correction visible in this data is the long tail of insurance hikes, inventory backlog, and softer demand from out-of-state buyers.
If you’re shopping the median, expect a three-bedroom older single-family home or a newer two-bedroom condo. The under-$210K end is mostly older condos and townhomes. The $440K end is newer single-family in master-planned communities.
Fort Myers Home Prices by Neighborhood
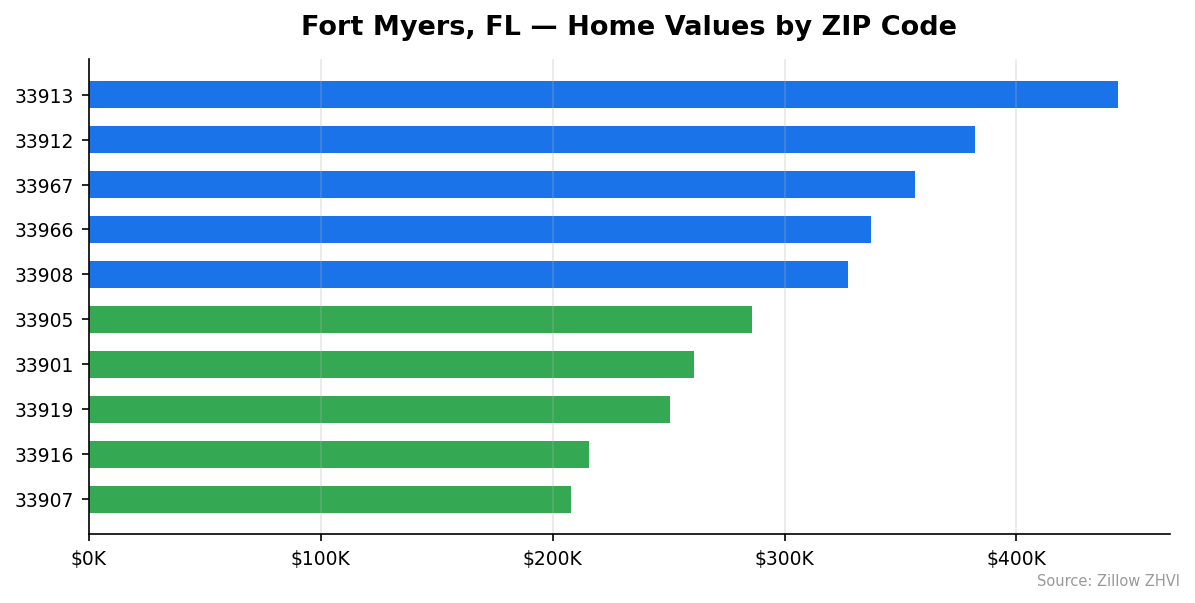
Ten ZIP codes make up the Fort Myers market. Here’s the full breakdown, sorted from most to least expensive.
| ZIP | Median Home Value | Avg Rent (ZORI) |
|---|---|---|
| 33913 | $444,002 | $2,187 |
| 33912 | $382,192 | $2,005 |
| 33967 | $356,304 | $1,996 |
| 33966 | $337,491 | $1,723 |
| 33908 | $327,322 | $1,814 |
| 33905 | $285,971 | $1,872 |
| 33901 | $260,973 | $1,599 |
| 33919 | $250,700 | $1,673 |
| 33916 | $215,472 | $1,552 |
| 33907 | $207,705 | $1,309 |
Most Expensive
33913 at $444,002 — That’s 45% above the city median. Rent here also tops the list at $2,187, the only ZIP clearing $2,000 in monthly rent.
33912 at $382,192 — A 25% premium over the city average. Rents track at $2,005, the second-highest in the city.
33967 at $356,304 — Sits 16% above the median with rents at $1,996. The price-to-rent ratio runs tighter here than in the top two ZIPs.
Most Affordable
33907 at $207,705 — The floor of the Fort Myers market, 32% below the median. Rents are the lowest in the city at $1,309.
33916 at $215,472 — Roughly 30% below the city average. Rent runs $1,552, modest given the entry price.
33919 at $250,700 — About 18% below the median, with rent at $1,673. The cheapest ZIP that still clears the $250K mark.
Rent vs Buy in Fort Myers
The average ZIP rent across Fort Myers comes out to about $1,773 per month. The cheapest ZIP rents for $1,309. The most expensive runs $2,187.
Now run the buy math. A median home at $306,813, with 10% down at a 7% rate, generates a mortgage payment near $1,840 on principal and interest alone. Add property taxes, Florida insurance (which is brutal in Lee County), HOA, and maintenance, and the all-in monthly cost easily clears $2,800.
| Scenario | Monthly cost (estimate) |
|---|---|
| Average ZIP rent | $1,773 |
| Mortgage P&I (10% down, 7%) | $1,840 |
| Buy with taxes + insurance + maint | $2,700-3,000 |
Renting wins on cash flow by roughly $1,000 a month at the median. The gap is even wider in the cheaper ZIPs. In 33907, you can rent for $1,309 versus a buy cost approaching $2,000 all-in.
The case for buying in Fort Myers right now isn’t monthly savings. It’s betting that prices have corrected enough and the next leg is up. If you believe values are near the bottom, locking in today gets you a discount versus 2024 buyers. If you think the slide continues, every month you wait is a month you don’t lose equity.
For most buyers without a long timeline, the math says rent.
Population Growth and Migration
Fort Myers added 12,630 residents between 2020 and 2024. That’s a 14.5% gain in four years, double the rate of Tampa and Orlando.
| Year | Population |
|---|---|
| 2020 | 87,288 |
| 2021 | 93,307 |
| 2022 | 96,324 |
| 2023 | 98,378 |
| 2024 | 99,918 |
The city is on the verge of crossing 100,000 people. Growth slowed each year — 6.9% in 2021, then 3.2%, 2.1%, and 1.6% in 2024 — but the direction has stayed positive even after Hurricane Ian.
How does that compare to other Florida cities?
| City | 2024 Population | 4-yr Growth |
|---|---|---|
| Port St. Lucie | 258,575 | 25.0% |
| Cape Coral | 233,025 | 19.2% |
| Fort Myers | 99,918 | 14.5% |
| Miami | 487,014 | 10.0% |
| Orlando | 334,854 | 8.8% |
| Tampa | 414,547 | 6.7% |
Fort Myers grew faster than Miami, Orlando, and Tampa. Only Port St. Lucie and neighboring Cape Coral expanded quicker. So you have a strange picture: prices are falling, but people keep arriving. That usually means supply is outpacing demand — likely from new construction in the metro and resale inventory loosening as sellers who held through 2022-2024 finally list.
For housing demand, the long-run signal is positive. The short-run signal is that there’s still more home for sale than buyers willing to meet sellers’ prices.
Fort Myers Housing Market Trends
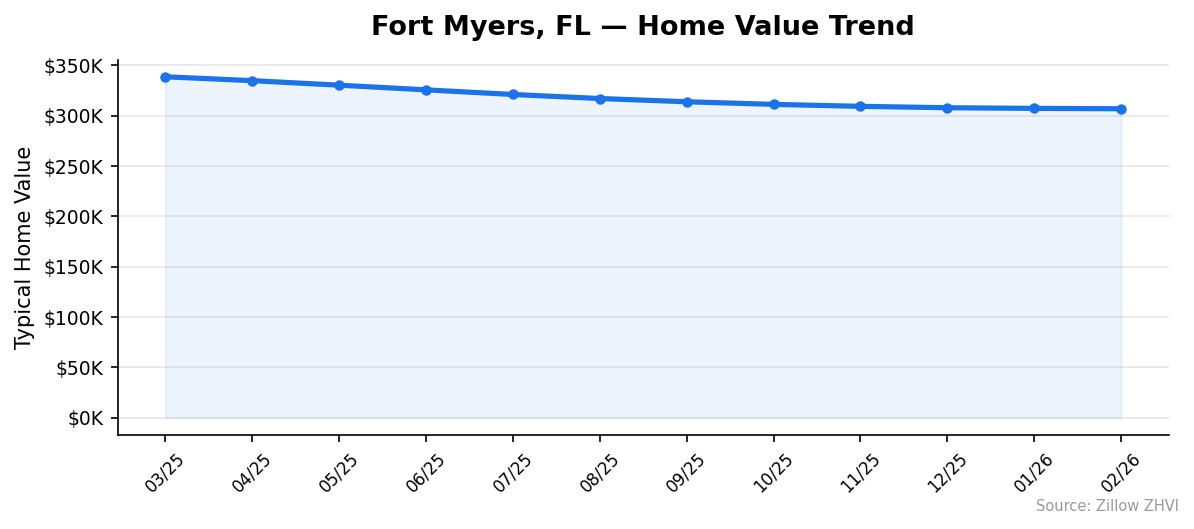
Twelve straight months of declines. The data is clean and one-directional.
| Month | Median Value | Monthly Change |
|---|---|---|
| Mar 2025 | $338,565 | — |
| Apr 2025 | $334,720 | -1.1% |
| May 2025 | $330,231 | -1.3% |
| Jun 2025 | $325,590 | -1.4% |
| Jul 2025 | $320,978 | -1.4% |
| Aug 2025 | $316,980 | -1.2% |
| Sep 2025 | $313,757 | -1.0% |
| Oct 2025 | $311,168 | -0.8% |
| Nov 2025 | $309,220 | -0.6% |
| Dec 2025 | $307,825 | -0.5% |
| Jan 2026 | $307,188 | -0.2% |
| Feb 2026 | $306,813 | -0.1% |
The monthly drops peaked in mid-2025 around 1.4%. They’ve shrunk every month since. The most recent two months — January and February — moved by just 0.2% and 0.1%. That’s the closest thing to a flatline this market has shown in a year.
The deceleration matters. A market that goes from -1.4% per month to -0.1% per month is a market finding its floor, not one in free fall. Whether the floor holds depends on inventory and rates through spring 2026.
Is Fort Myers a Good Place to Buy in 2026?
This is a buyer’s market. The data is unambiguous.
You have prices down 9.4% year over year, twelve consecutive monthly declines, a wide ZIP price range that gives buyers room to negotiate, and population growth that supports long-run demand. Sellers who bought at the 2022 peak are underwater on paper if they sell today.
The catch is timing. The market is decelerating but hasn’t turned. February 2026 prices are 0.1% below January, suggesting the bleeding has nearly stopped. Buyers who pulled the trigger in mid-2025 caught falling knives. Buyers waiting for a confirmed bottom may miss the first leg up.
Two practical takeaways. First, you have room to negotiate. Sellers know what comparable sales look like, and they know they need to discount versus zestimates from a year ago. Don’t pay list price. Second, focus on insurance. Lee County premiums are a meaningful share of the all-in monthly cost, and not pricing them in is the most common mistake out-of-state buyers make.
For a long-term buyer, the math is reasonable. For a flipper or short-hold buyer, the data still says wait.
Fort Myers Housing Market Outlook for 2026-2027
The 3-month trend is the most useful piece of forward-looking data. December to January was a 0.2% drop. January to February was 0.1%. If the current pace continues, prices flatten by late spring 2026.
That doesn’t mean prices rise. A flat market and a rising market are different things. The 12-month trajectory has been down all year, and it would take several months of zero or positive prints to confirm a bottom.
The most likely scenario based on the visible data: small additional declines through Q2 2026, then stabilization. A return to year-over-year price growth would require the monthly trend to flip positive for at least three consecutive months. Nothing in the current data shows that flip yet.
Watch the March and April 2026 numbers. If those come in flat or slightly positive, the correction is over. If they show fresh 0.5%+ drops, the floor wasn’t where it looked.
Similar Markets in FL
- Tampa — A larger Gulf Coast metro where price action has held up better than Fort Myers.
- Orlando — Inland Florida with stronger population growth and tighter inventory than Fort Myers.
- Jacksonville — The cheapest big-city option in Florida, often compared to Fort Myers on affordability.
- Port Saint Lucie — Fort Myers buyers looking for similar pricing on the Atlantic side often consider Port Saint Lucie.
- Homestead — South Florida’s most affordable entry point, comparable to Fort Myers’ lower ZIPs.
Frequently Asked Questions
What is the average home price in Fort Myers?
The average home price in Fort Myers, FL is $306,813 as of February 2026. That figure is the median of the Zillow Home Value Index across 10 ZIP codes in the city. It’s down from $338,565 a year earlier.
Are home prices going up or down in Fort Myers?
Down. Year over year, prices fell 9.4%, and the data shows twelve consecutive monthly declines. The pace of decline has slowed sharply in recent months, with February 2026 down only 0.1% from January.
Is it cheaper to rent or buy in Fort Myers?
Renting is meaningfully cheaper. The average ZIP rent runs about $1,773 per month, while a mortgage on a median-priced home with taxes and insurance lands closer to $2,700-3,000. The gap is roughly $1,000 a month at the median.
What is the most affordable neighborhood in Fort Myers?
ZIP 33907 is the cheapest, with a median value of $207,705 and the lowest rent in the city at $1,309. ZIP 33916 is the next-cheapest at $215,472, with rent around $1,552.
Methodology
Home values are based on the Zillow Home Value Index (ZHVI), a smoothed measure of typical home values in the 35th to 65th percentile range. Rent estimates use the Zillow Observed Rent Index (ZORI). Population figures come from the U.S. Census Bureau Population Estimates Program (2020-2024 vintage). All datasets are publicly available. Housing data updated 2026-02-28.