Waco Home Prices: $199K, Down 1.7% — 7 ZIPs Analyzed (2026)
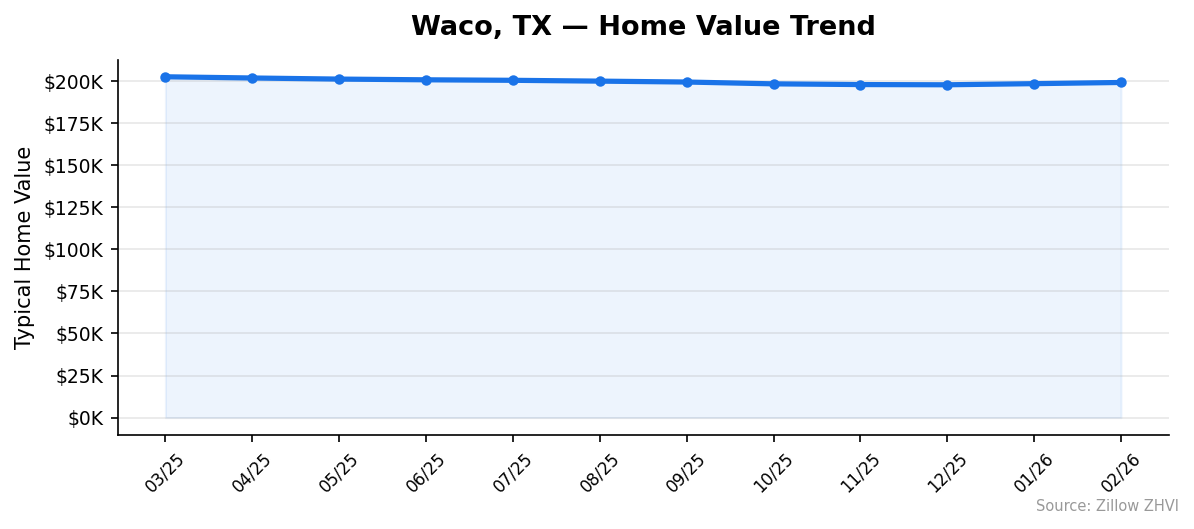
$199,218. That’s what a typical home in Waco was worth at the end of February 2026, down 1.7% from a year earlier. Prices peaked last spring near $202,600 and have drifted lower for most of the past twelve months.
Quick answer: The average home price in Waco, TX is $199,218 as of February 2026, down 1.7% year over year according to Zillow.
Current Home Prices in Waco
The Waco market sits well below the Texas average and far under the national figure. A buyer with a $200K budget can still find inventory across most of the city.
| Metric | Value |
|---|---|
| Median home value | $199,218 |
| Year-over-year change | -1.7% |
| Cheapest ZIP | $110,240 (76704) |
| Most expensive ZIP | $297,932 (76701) |
| Price range across ZIPs | $187,692 spread |
| ZIP codes tracked | 7 |
| Data as of | February 2026 |
The spread between Waco’s cheapest and priciest ZIPs is nearly $188,000. That gap matters more than the city-wide median for anyone shopping a specific neighborhood. A home in 76704 costs roughly 37% of a home in 76701 — practically two different markets sharing one city name.
The 1.7% annual decline is mild compared to what bigger Texas metros have logged. Austin homes are off about 4% over similar periods. Waco’s correction looks more like a soft reset than a slide.
You’re buying into a market that has cooled off the spring 2025 peak but has not collapsed. Year-over-year losses have stayed inside a 2% band for months, suggesting the market has found a floor near $197K to $200K.
Waco Home Prices by Neighborhood
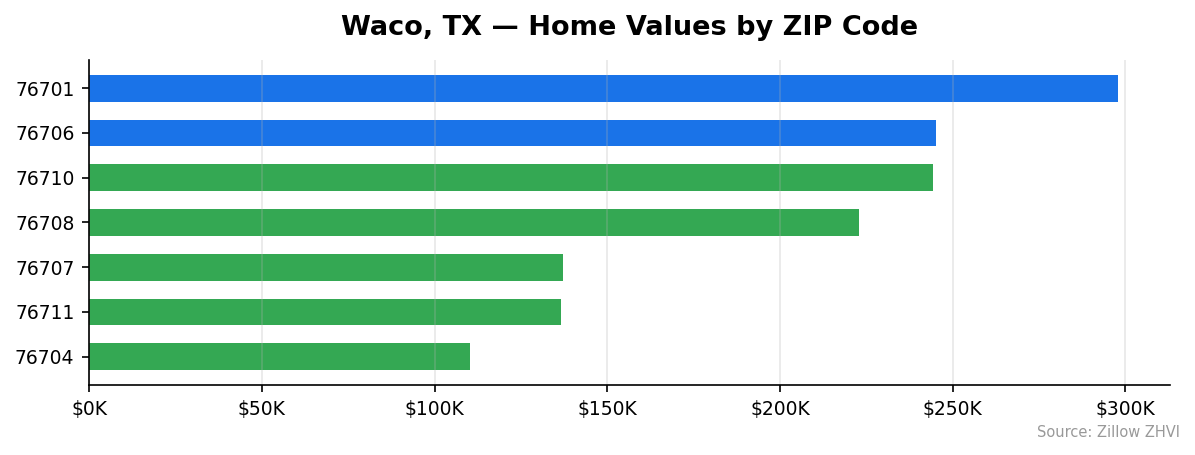
Seven ZIP codes carry the Waco housing market. The split is sharp: three ZIPs sit above $220K, two cluster around $137K, and one each anchor the top and bottom.
| ZIP Code | Median Home Value | Avg Rent (Monthly) |
|---|---|---|
| 76701 | $297,932 | Data not available |
| 76706 | $245,221 | $1,411 |
| 76710 | $244,424 | $1,254 |
| 76708 | $222,826 | $1,536 |
| 76707 | $137,181 | $1,448 |
| 76711 | $136,702 | $1,272 |
| 76704 | $110,240 | Data not available |
Most Expensive
76701 leads at $297,932 — roughly 50% above the city median and the only ZIP above $250K.
76706 comes next at $245,221, with rents averaging $1,411 a month, suggesting a strong owner-occupier market with steady rental demand.
76710 runs nearly identical at $244,424 but with notably lower rents near $1,254, hinting at a more ownership-heavy mix.
Most Affordable
76704 is the cheapest at $110,240, about 45% below the city median.
76711 at $136,702 still sits well under the typical Waco home, with average rent of $1,272 indicating active rental supply.
76707 at $137,181 is nearly tied with 76711, but its $1,448 average rent runs higher — meaning rent-to-price ratios there favor landlords more than renters.
Rent vs Buy in Waco
Renting wins on monthly cash flow in Waco — for now.
Average rent across the five ZIPs with data: $1,384 a month.
A buyer putting 20% down ($39,800) on the $199,218 median home finances roughly $159,400. At a 7% mortgage rate, principal and interest land near $1,060. Texas property taxes — among the highest in the country — add about $330 a month at a 2% effective rate. Insurance tacks on another $150. Total monthly outlay: roughly $1,540 before maintenance.
| Cost Type | Monthly Estimate |
|---|---|
| Average rent (5 ZIPs) | $1,384 |
| Mortgage P&I (20% down, 7%) | $1,060 |
| Property tax (~2%) | $330 |
| Insurance | $150 |
| Owner total | ~$1,540 |
The gap is about $156 a month in favor of renting. That ignores the $39,800 down payment a buyer locks up and the equity a buyer accrues each month. The breakeven flips quickly if rates drop or if you stay put for five-plus years.
ZIP-level rent ranges from $1,254 in 76710 to $1,536 in 76708. If you’re rent-shopping, those two ZIPs frame the market.
Population Growth and Migration
Waco is gaining people — slowly, steadily, and without the boom-or-bust swings of bigger Texas metros.
| Year | Population |
|---|---|
| 2020 | 140,543 |
| 2021 | 142,357 |
| 2022 | 143,293 |
| 2023 | 144,943 |
| 2024 | 146,608 |
That’s a 4.3% gain over four years, or roughly 1,500 new residents annually. Every year since 2020 has shown a positive bump, with no down years in the trend.
How does Waco stack up against other Texas cities?
| City | 2024 Population | 4-Year Growth |
|---|---|---|
| Fort Worth | 1,008,106 | +9.1% |
| San Antonio | 1,526,656 | +6.1% |
| Lubbock | 272,086 | +5.4% |
| Waco | 146,608 | +4.3% |
| Houston | 2,390,125 | +4.0% |
| Austin | 993,588 | +2.9% |
Waco grew faster than Houston and Austin over the same window. Fort Worth and San Antonio outpaced it, but those are metros 7-10x larger.
For housing demand, this matters. A city adding 1,500 residents a year — without a flood of new construction — keeps a baseline floor under prices even when the broader market softens. The 1.7% price decline you’re seeing in Waco is happening despite population growth, not because of decline.
Waco Housing Market Trends
The 12-month picture shows a market that peaked in spring 2025 and has eased since.
| Month | Median Value | Range |
|---|---|---|
| Feb 2026 | $199,218 | $110K–$298K |
| Jan 2026 | $198,508 | $111K–$294K |
| Dec 2025 | $197,846 | $112K–$290K |
| Nov 2025 | $197,975 | $113K–$290K |
| Oct 2025 | $198,399 | $112K–$290K |
| Sep 2025 | $199,480 | $112K–$292K |
| Aug 2025 | $200,012 | $111K–$292K |
| Jul 2025 | $200,504 | $111K–$292K |
| Jun 2025 | $200,803 | $111K–$291K |
| May 2025 | $201,228 | $113K–$291K |
| Apr 2025 | $201,883 | $115K–$290K |
| Mar 2025 | $202,596 | $118K–$288K |
The peak of $202,596 came in March 2025. From there, prices fell every month through December, bottoming at $197,846. The last two months show small upticks — December to February gained back $1,372.
The top end of the market actually rose. The most expensive ZIP value climbed from $288,367 in March 2025 to $297,932 in February 2026 — a $9,565 gain. The bottom end fell from $118,226 to $110,240, an $8,000 drop.
Translation: high-end Waco held value. Entry-level homes lost ground.
Is Waco a Good Place to Buy in 2026?
Buyers have the upper hand in Waco right now, but it’s not a fire sale.
Prices are 1.7% lower than a year ago and roughly $3,400 below the spring 2025 peak. That’s a small discount, not a crash. Inventory at the entry level — homes under $140K in 76704, 76707, and 76711 — has gotten cheaper, while higher-end homes in 76701 and 76706 have held or gained.
The math favors buyers in three scenarios:
- You want a home under $150K (entry-level prices fell 7%)
- You plan to stay 5+ years (rent vs buy gap closes around year 4)
- You can put 20% down to keep monthly costs near rent
It favors sellers if your home sits in 76701 or 76706, where values rose. List prices in those ZIPs are supported by data — the rest of the city, less so.
This is a slow market with light tailwinds: positive population growth, mild price softness, rents that match mortgages on a monthly basis. Not a rush. Not a panic. A market for patient buyers.
Waco Housing Market Outlook for 2026-2027
The 3-month trend points to stabilization. Prices have moved from $197,846 in December to $199,218 in February — a $1,372 gain over two months.
If the current pace continues, Waco could test the $200K mark again by mid-2026. That would still leave it below the spring 2025 peak.
The high end of the market is the strongest signal. The most expensive ZIP gained roughly $9,500 over twelve months while the city-wide median fell. When premium inventory holds firm during a soft patch, it usually means the broader market follows within a couple of quarters.
The wildcard is mortgage rates. The current price floor near $197K depends on rates staying where they are. A drop into the 5s would release pent-up buyer demand and push prices higher. A spike back into the 8s would extend the slide.
Population growth of 1.5K residents a year keeps a structural floor under demand. Don’t expect a sharp move in either direction.
Similar Markets in TX
If Waco fits your budget, these Texas cities offer different price points worth comparing:
- Houston — Texas’s largest city offers more inventory variety, though typically at higher price points than Waco.
- San Antonio — Another mid-size Texas market with similar affordability dynamics and population growth above Waco’s.
- El Paso — Border-region city with prices that often run closer to Waco’s lower end.
- Brownsville — South Texas market with comparable population scale and pricing tier.
- Grand Prairie — DFW suburb that contrasts Waco’s standalone market with metro-adjacent pricing.
Frequently Asked Questions
What is the average home price in Waco?
The average home price in Waco, TX is $199,218 as of February 2026. That figure represents the typical mid-tier home value across the city’s 7 ZIP codes, ranging from $110,240 in the cheapest area to $297,932 in the priciest.
Are home prices going up or down in Waco?
Prices are down 1.7% year over year. The median peaked at $202,596 in March 2025 and has drifted lower since, though the last two months show modest gains of about $1,400 combined.
Is it cheaper to rent or buy in Waco?
Renting edges out buying by roughly $156 a month. Average rent runs about $1,384, while owning the median $199K home costs near $1,540 monthly with 20% down at 7% mortgage rates, including Texas property taxes and insurance.
What is the most affordable neighborhood in Waco?
ZIP 76704 is the cheapest at $110,240 — about 45% below the city median. ZIPs 76711 ($136,702) and 76707 ($137,181) round out the three most affordable areas.
Methodology
Home values are based on the Zillow Home Value Index (ZHVI), a smoothed measure of typical home values in the 35th to 65th percentile range. Rent estimates use the Zillow Observed Rent Index (ZORI). Population figures come from the U.S. Census Bureau Population Estimates Program (2020-2024 vintage). All datasets are publicly available. Housing data updated 2026-02-28.