San Angelo Home Prices: $248K, Up 3.3% — 3 ZIPs Analyzed (2026)
$247,906. That’s what a typical home costs in San Angelo as of February 2026, and it’s 3.3% more than buyers paid a year ago. The market here is small — only three ZIP codes — but the spread between them is wide.
Quick answer: The average home price in San Angelo, TX is $247,906 as of February 2026, up 3.3% year over year according to Zillow.
Current Home Prices in San Angelo
The typical San Angelo home sits at $247,906. That’s a $7,841 increase from twelve months ago. Within the metro, values range from $171,039 on the low end to $327,583 at the top — a $156,544 gap between the cheapest and priciest ZIP.
| Metric | Value |
|---|---|
| Median home value | $247,906 |
| Year-over-year change | +3.3% |
| Lowest ZIP | $171,039 |
| Highest ZIP | $327,583 |
| ZIPs analyzed | 3 |
| Data through | February 2026 |
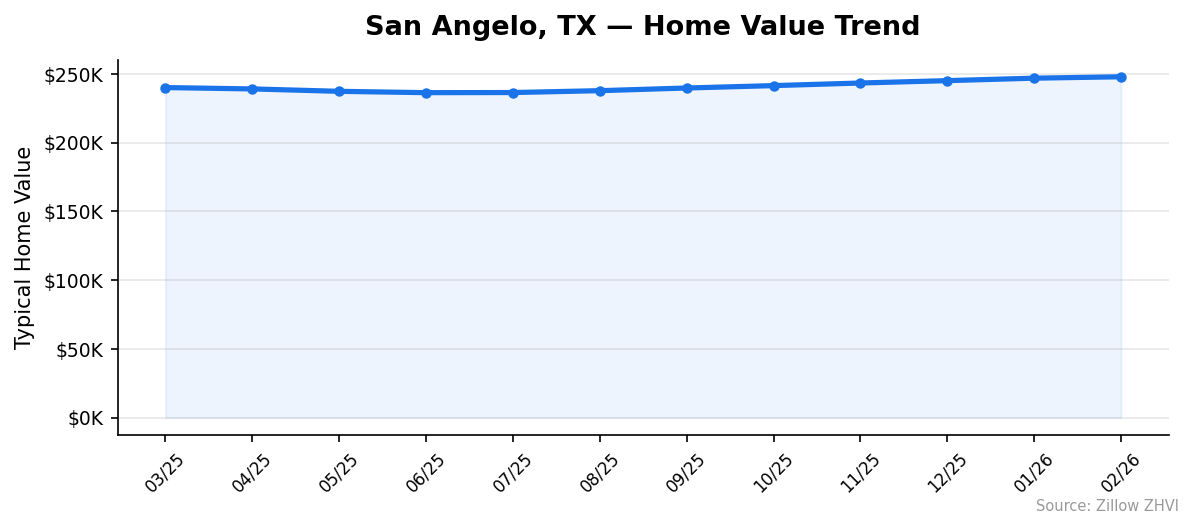
The 3.3% gain looks routine on paper. The shape of the year tells a different story. Prices fell from $240,065 in March 2025 down to $236,360 by June, then turned and ran. Every month since has posted a gain. February 2026 marks the eighth straight monthly increase.
That puts San Angelo above its prior peak. Buyers who waited out the summer dip got nothing for their patience — values are now $11,500 higher than they were nine months ago.
The middle of the market is where most of San Angelo lives. With only three ZIPs in the metro, the median is heavily influenced by ZIP 76905, which sits almost exactly at the citywide average. The high end is propped up by 76904 alone.
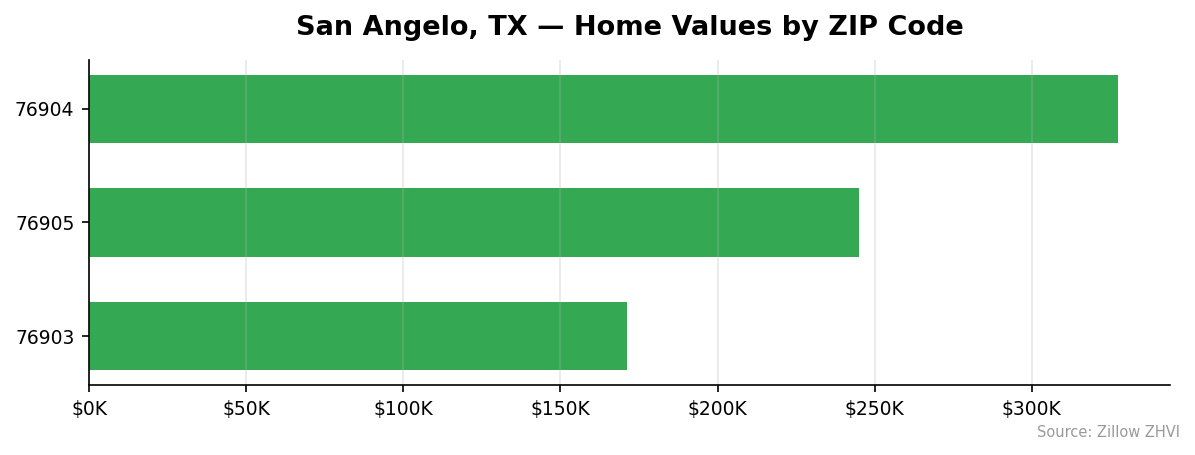
San Angelo Home Prices by Neighborhood
San Angelo splits cleanly into three price tiers, one ZIP each. There’s no overlap and no ambiguity about which side of town you’re on.
| ZIP Code | Home Value | Avg Rent | vs City Avg |
|---|---|---|---|
| 76904 | $327,583 | $1,226 | +32.1% |
| 76905 | $245,097 | $1,519 | -1.1% |
| 76903 | $171,039 | $1,232 | -31.0% |
Most Expensive
76904 — $327,583. The priciest ZIP in the metro, sitting $79,677 above the city average. Despite the higher home values, rents here are the lowest of the three at $1,226, suggesting an owner-heavy market rather than an investor one.
76905 — $245,097. The middle tier and the only ZIP near the citywide median. Rents are the highest of the three at $1,519 a month, hinting at a stronger rental demand relative to home prices.
Most Affordable
76903 — $171,039. The cheapest ZIP by a wide margin and the only one under $200,000. A buyer here pays $156,544 less than a buyer in 76904 for a typical home. Rent is $1,232 — almost identical to the higher-priced 76904, which makes 76903 the strongest cash-flow ZIP for landlords.
Rent vs Buy in San Angelo
The average rent across San Angelo’s three ZIPs is $1,326 a month. The math against buying is straightforward.
A 20% down payment on a $247,906 home leaves a $198,325 mortgage. At a 7% rate over 30 years, principal and interest run about $1,320 a month. Add property taxes (Texas runs high — figure $400 monthly on this price) and insurance ($150), and the all-in payment lands near $1,870.
| Cost | Monthly |
|---|---|
| Average rent | $1,326 |
| Mortgage P&I (20% down, 7%) | $1,320 |
| Property tax estimate | $400 |
| Insurance estimate | $150 |
| Total ownership cost | ~$1,870 |
Renting is roughly $544 a month cheaper than buying right now. That gap doesn’t account for the $49,581 down payment a buyer needs upfront, or the equity an owner builds over time.
ZIP-level rent shows an unusual pattern. The cheapest neighborhood (76903) and the priciest (76904) rent for nearly the same money — about $1,230. The middle-tier 76905 rents for $1,519, the most in the metro. If you’re renting and want to save, 76903 and 76904 deliver similar monthly costs in very different settings.
Population Growth and Migration
San Angelo had 100,159 residents in 2024. That’s 94 more people than lived here in 2020. The 4-year growth rate is 0.1%.
| Year | Population |
|---|---|
| 2020 | 100,065 |
| 2021 | 99,411 |
| 2022 | 99,202 |
| 2023 | 99,513 |
| 2024 | 100,159 |
The city actually lost population for two years before recovering. By 2022 it had dropped to 99,202 — about 863 fewer residents than in 2020. Growth resumed in 2023 and accelerated in 2024, with the city adding 646 people in a single year.
Compared to other Texas cities, San Angelo is barely moving.
| City | 2024 Population | 4-Year Growth |
|---|---|---|
| Fort Worth | 1,008,106 | +9.1% |
| San Antonio | 1,526,656 | +6.1% |
| Lubbock | 272,086 | +5.4% |
| Houston | 2,390,125 | +4.0% |
| Austin | 993,588 | +2.9% |
| San Angelo | 100,159 | +0.1% |
For housing, slow population growth caps demand. San Angelo’s 3.3% price gain isn’t being driven by people pouring in — there are essentially the same number of households as five years ago. The price pressure is coming from somewhere else: limited inventory, rising replacement costs, and broader Texas market trends.
San Angelo Housing Market Trends
Twelve months of data show a market that bent but didn’t break.
| Month | Avg Value |
|---|---|
| Mar 2025 | $240,065 |
| Apr 2025 | $239,080 |
| May 2025 | $237,332 |
| Jun 2025 | $236,360 |
| Jul 2025 | $236,447 |
| Aug 2025 | $237,805 |
| Sep 2025 | $239,751 |
| Oct 2025 | $241,485 |
| Nov 2025 | $243,379 |
| Dec 2025 | $245,103 |
| Jan 2026 | $246,903 |
| Feb 2026 | $247,906 |
The drop from March to June was $3,705 — a 1.5% decline. Then the climb began. From June to February, values rose $11,546, or 4.9%. The recent pace has been about $1,000 to $1,800 per month.
The bottom of the market (76903) followed the same shape but moved harder. It dropped from $165,044 in March 2025 to $156,832 in July, then rebounded to $171,039. That’s a 9% swing low to high in eight months, more volatile than the city average.
The top (76904) barely moved during the summer dip — from $316,764 in March 2025 down to $315,792 in May, a decline of less than 0.4% — before climbing to $327,583. High-end inventory held value better through the soft patch.
Is San Angelo a Good Place to Buy in 2026?
San Angelo looks like a seller’s market right now, but a quiet one.
The case for sellers: prices have risen for eight consecutive months, the city is back above its prior peak, and the YoY gain of 3.3% is positive. Inventory pressure exists. With only three ZIPs and a population that grew 0.6% last year alone, even modest demand bumps push prices.
The case for buyers: the market is small enough that pricing is uneven. The $156,544 gap between 76903 and 76904 means a buyer willing to flex on neighborhood can save substantially. Renting is also $544 a month cheaper than buying, which gives buyers room to wait if rates fall.
Population growth tells you not to expect a frenzy. San Angelo isn’t Austin or Fort Worth. The 4-year growth rate of 0.1% means demand is steady, not surging. Price appreciation here is more about supply constraints than migration pressure.
If you want a starter home, 76903 is the obvious target. If you want appreciation, 76904 has been the most stable performer. The middle ZIP, 76905, hasn’t done anything special in either direction.
San Angelo Housing Market Outlook for 2026-2027
The 3-month trend points up. December through February added $2,803 to the typical home value — about $935 a month. If the current pace continues through summer, San Angelo could test the $255,000 mark by July.
That’s a big “if.” Last year the market peaked in March, then dropped for three months. The same seasonal pattern could repeat. Buyers tracking a specific ZIP should watch for a soft May or June.
The longer trend is harder to dismiss. From the June 2025 low at $236,360 to February 2026 at $247,906, the market gained 4.9% in eight months. That’s faster than the 3.3% YoY figure suggests.
Population growth is too slow to fuel a runaway market. Expect appreciation to moderate if rates stay elevated, with the gap between 76903 and 76904 likely to stay wide. The 12-month direction is positive but small Texas markets like San Angelo rarely move in straight lines.
Similar Markets in TX
San Angelo’s $247,906 median sits between several larger Texas markets worth comparing.
- Houston — A much larger metro with deeper inventory; San Angelo buyers priced out of urban Texas often look here for similar dollar value.
- San Antonio — Bigger and faster-growing, with 6.1% population gains over four years versus San Angelo’s 0.1%.
- El Paso — Another mid-tier Texas market with comparable affordability profiles to San Angelo’s lower ZIPs.
- Brownsville — Often the cheapest entry point in Texas; useful comparison for buyers focused on 76903.
- Dallas — A high-growth metro that shows what San Angelo’s market is not — large, expensive, and migration-driven.
Frequently Asked Questions
What is the average home price in San Angelo?
The average home price in San Angelo, TX is $247,906 as of February 2026. The metro range runs from $171,039 in ZIP 76903 up to $327,583 in ZIP 76904. That’s a $156,544 spread within a city of just over 100,000 people.
Are home prices going up or down in San Angelo?
Prices are up 3.3% over the past twelve months. The market bottomed at $236,360 in June 2025 and has climbed every month since, gaining $11,546 by February 2026. The last three months added about $935 per month on average.
Is it cheaper to rent or buy in San Angelo?
Renting is cheaper by roughly $544 a month. Average rent across the three ZIPs is $1,326, while a typical mortgage on a $247,906 home (20% down, 7% rate) plus taxes and insurance comes to about $1,870. Owners build equity, but the upfront $49,581 down payment is a barrier.
What is the most affordable neighborhood in San Angelo?
ZIP 76903 is the cheapest at $171,039, which is 31% below the city average. It’s the only ZIP in San Angelo with a typical home value under $200,000. Rent here is $1,232, nearly identical to the higher-priced 76904 — making it the strongest cash-flow option for landlords.
Methodology
Home values are based on the Zillow Home Value Index (ZHVI), a smoothed measure of typical home values in the 35th to 65th percentile range. Rent estimates use the Zillow Observed Rent Index (ZORI). Population figures come from the U.S. Census Bureau Population Estimates Program (2020-2024 vintage). All datasets are publicly available. Housing data updated 2026-02-28.