Redding Home Prices: $384K, Down 1.3% — 3 ZIPs Analyzed (2026)
$383,918. That’s what a typical Redding home is worth as of February 2026 — down 1.3% from a year earlier. Prices have drifted lower almost every month across the past twelve.
Quick answer: The average home price in Redding, CA is $383,918 as of February 2026, down 1.3% year over year.
Current Home Prices in Redding
The median Redding home is worth $383,918. A year ago the figure sat closer to $389,000. That’s a $5,000 drop over twelve months.
| Metric | Value |
|---|---|
| Median home value | $383,918 |
| Year-over-year change | -1.3% |
| Lowest ZIP | $373,096 |
| Highest ZIP | $398,758 |
| Price spread (high-low) | $25,662 |
| Month of data | February 2026 |
| ZIP codes tracked | 3 |
Redding sits well below the California statewide median. For a state known for seven-figure housing bills, Shasta County’s largest city reads as an outlier — homes here run about a third of what you’d pay along the coast.
The price spread across Redding is narrow. Only $25,662 separates the cheapest ZIP from the most expensive. Compare that to Los Angeles, where neighborhoods can differ by $1 million or more. In Redding, you’re picking between similar options at similar prices.
The declining trend matters more than the absolute number. You’re buying into a market that’s been giving back value for nearly a year. If you’re a buyer, that’s an opening — sellers are negotiating. If you’re a seller, it means pricing to last year’s comps won’t work.
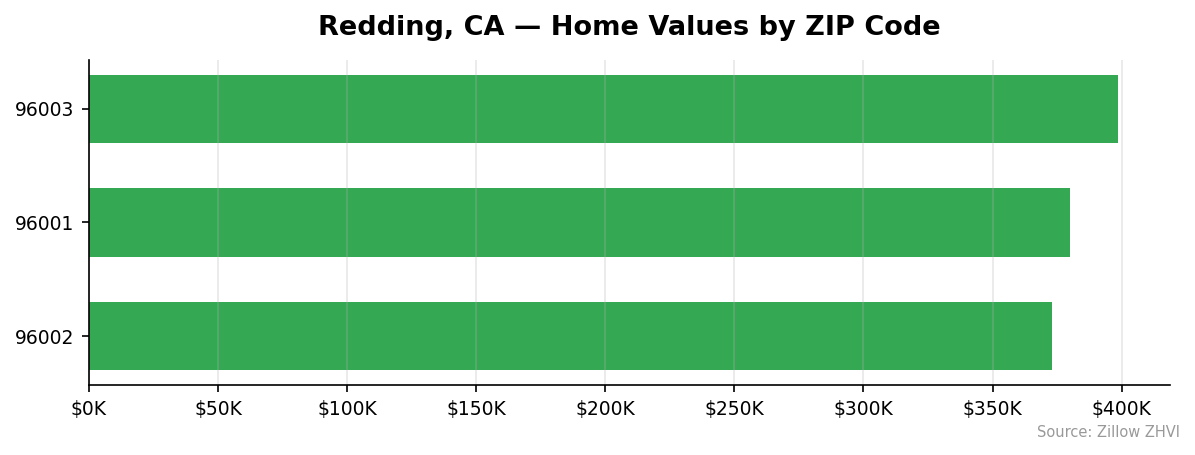
Redding Home Prices by Neighborhood
Three ZIPs cover most of the city. Only about 7% separates the most expensive from the cheapest.
| ZIP | Typical home value | Typical monthly rent |
|---|---|---|
| 96003 | $398,758 | $1,635 |
| 96001 | $379,900 | $1,565 |
| 96002 | $373,096 | $1,687 |
Most Expensive
96003 — $398,758. The priciest ZIP, sitting $14,840 above the city median. Rent averages $1,635, right in the middle of the three.
Most Affordable
96002 — $373,096. About $10,822 below the city median. The rent data tells an interesting story — 96002 is the cheapest to buy but the most expensive to rent at $1,687. That gap often signals tighter rental supply relative to ownership inventory, which can be a good sign for buyers planning to rent out a property.
96001 — $379,900. Slightly below the city median. Rents are the lowest of the three at $1,565.
Rent vs Buy in Redding
Rent across Redding’s three ZIPs averages about $1,629 per month:
| ZIP | Typical monthly rent |
|---|---|
| 96002 | $1,687 |
| 96003 | $1,635 |
| 96001 | $1,565 |
Renting costs less than owning at current prices. Between principal, interest, property taxes, and insurance, the monthly carrying cost of a $384K home runs well above the $1,629 you’d pay to rent a comparable place.
The price-to-rent ratio — median home price divided by annual rent — sits near 19.6 in Redding. That’s borderline. A ratio above 20 usually favors renters; below 15 favors buyers. Redding sits just inside renter-favored territory, but not by much.
For buyers, the long-term case still exists. Equity builds over years, rents rise, and a fixed mortgage locks in housing costs. But with prices dropping 1.3% annually, the appreciation argument is weaker now than it was in 2021 or 2022.
If you plan to stay under five years, the rent math likely wins. Past that, ownership starts to pencil out — especially if you buy near a market bottom.
Population Growth and Migration
Redding had 93,502 residents in 2024. That’s down from 93,799 in 2020 — a 0.3% loss over four years.
The city isn’t emptying out, but it isn’t growing either. Every other California city on the comparison list added residents over the same period.
| City | 2024 population | 4-year growth |
|---|---|---|
| Redding | 93,502 | -0.3% |
| Bakersfield | 417,468 | +3.0% |
| Sacramento | 535,798 | +1.9% |
| San Diego | 1,404,452 | +1.4% |
| Fresno | 550,105 | +1.4% |
| Oakland | 443,554 | +0.6% |
Year-by-year, the trend:
| Year | Population |
|---|---|
| 2020 | 93,799 |
| 2021 | 93,701 |
| 2022 | 93,069 |
| 2023 | 93,013 |
| 2024 | 93,502 |
The 2022-2023 stretch was the weakest, with population dipping below 93,100. Then 2024 added about 490 residents — the first meaningful rebound in four years. Whether that sticks will shape housing demand into 2026 and 2027.
Flat population and falling prices go together. You’re seeing that play out in real time.
Redding Housing Market Trends
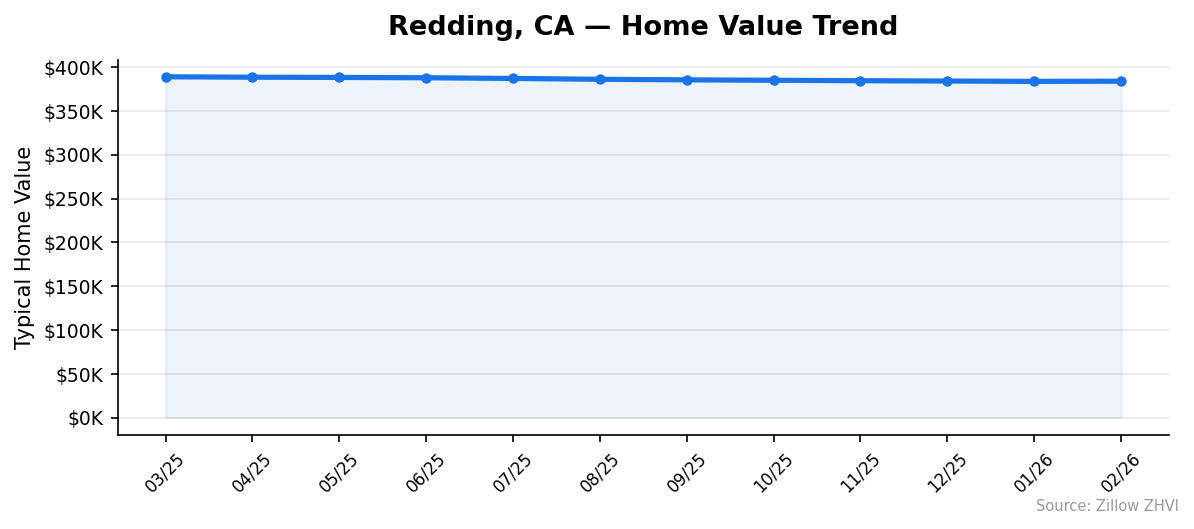
Twelve-month view. Prices slid almost every single month.
| Month | Avg value |
|---|---|
| March 2025 | $388,949 |
| April 2025 | $388,465 |
| May 2025 | $388,231 |
| June 2025 | $387,837 |
| July 2025 | $387,069 |
| August 2025 | $386,090 |
| September 2025 | $385,478 |
| October 2025 | $384,973 |
| November 2025 | $384,463 |
| December 2025 | $384,105 |
| January 2026 | $383,719 |
| February 2026 | $383,918 |
The typical home lost about $5,031 between March 2025 and February 2026. That’s a steady drip — about $400 per month — not a crash.
February 2026 broke the streak. Values ticked up $199 from January, the first monthly gain in eleven months. One data point doesn’t confirm a turn, but it’s the first positive signal in the series. The pace of decline was also slowing before that — December-to-January lost only $386, a fraction of the mid-summer slide.
Is Redding a Good Place to Buy in 2026?
The data points to a buyer’s market. Prices fell for ten straight months before the tiny February uptick. Population is essentially flat. Rents are below the cost of ownership.
If you plan to stay seven or more years, the math can still work — particularly if mortgage rates drop and refinancing becomes an option. For shorter horizons of two to three years, the price-to-rent ratio and the downward trend suggest renting keeps you flexible.
Sellers are in the harder spot. The median has dropped $5,000 in a year. Listings priced to 2023 comps will sit. Pricing realistically, even slightly under similar recent sales, matters more in a falling market than a rising one.
The one argument for waiting: another six to twelve months of softening could shave a few thousand more off your purchase price.
Redding Housing Market Outlook for 2026-2027
The three-month snapshot shows prices effectively flat. November 2025 read $384,463, February 2026 came in at $383,918 — a 0.14% decline. That’s a sharp slowdown from the earlier pace of drops.
If the current pace continues, expect another 0.5% to 1.5% downside over the next six months, with a possible bottom forming in late 2026 or early 2027. The February uptick is a hint, not a confirmation.
A real pickup would need one of three things: population growth accelerating past the 2024 rebound, mortgage rates easing, or a pullback in available inventory. None of those show up clearly in the data right now.
Reasonable expectation: flat to slightly down through mid-2027, then a slow recovery if broader California demand stabilizes.
Similar Markets in CA
Redding is one of the cheaper cities in the state. If you’re comparing options:
- Bakersfield — another inland California market with lower prices than the coast, but growing much faster than Redding at 3.0%.
- Fresno — mid-state alternative with a larger population and stronger growth.
- Riverside — inland Southern California, bigger city and higher price points.
- Long Beach — coastal option, significantly more expensive than Redding.
- Los Angeles — the LA metro benchmark for context on just how cheap Redding is by California standards.
Frequently Asked Questions
What is the average home price in Redding?
The median Redding home is worth $383,918 as of February 2026. That number comes from the Zillow Home Value Index across the three tracked ZIP codes. It’s down 1.3% from a year earlier.
Are home prices going up or down in Redding?
Down. Values fell 1.3% year over year and dropped nearly every month over the past twelve. February 2026 posted a small $199 uptick — the first monthly gain in almost a year — but the broader trend still points lower.
Is it cheaper to rent or buy in Redding?
Renting. Typical rents fall between $1,565 and $1,687 per month across the three Redding ZIPs. A $384K mortgage with property taxes and insurance runs well above that range, and the price-to-rent ratio of about 19.6 sits just inside renter-favored territory.
What is the most affordable neighborhood in Redding?
ZIP 96002 is the cheapest at $373,096 — about $10,800 below the city median. Notably, it has the highest rent of the three ZIPs at $1,687 per month, suggesting tighter rental supply than sale price would predict.
Methodology
Home values are based on the Zillow Home Value Index (ZHVI), a smoothed measure of typical home values in the 35th to 65th percentile range. Rent estimates use the Zillow Observed Rent Index (ZORI). Population figures come from the U.S. Census Bureau Population Estimates Program (2020-2024 vintage). All datasets are publicly available. Housing data updated 2026-02-28.