Torrance Home Prices: $1,159K, Up 0.6% — 4 ZIPs Analyzed (2026)
$1,158,667. That’s what a typical Torrance home was worth as of February 2026. Prices are up 0.6% from a year ago — essentially flat, after a mid-2025 dip that has since reversed.
Quick answer: The average home price in Torrance, CA is $1,158,667 as of February 2026, up 0.6% year over year according to Zillow.
Current Home Prices in Torrance
Torrance sits firmly in seven-figure territory. The typical home across the city’s four ZIP codes is worth $1.16M, and the spread between the cheapest and priciest ZIPs is more than $400,000.
| Metric | Value |
|---|---|
| Median home value | $1,158,667 |
| Year-over-year change | +0.6% |
| Cheapest ZIP average | $980,218 |
| Most expensive ZIP average | $1,398,055 |
| ZIP codes analyzed | 4 |
| Data as of | February 2026 |
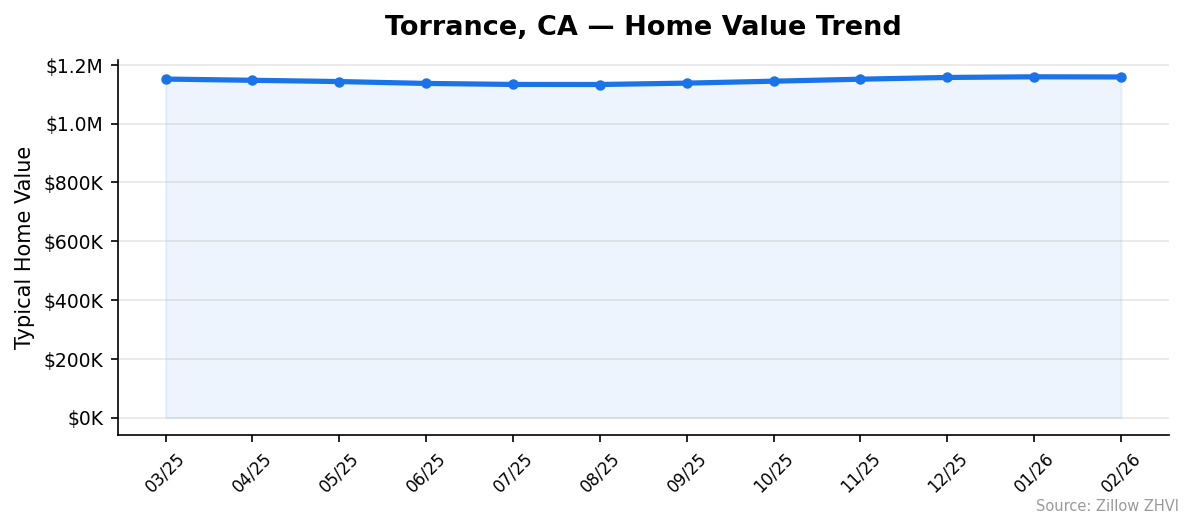
The 0.6% annual gain is the headline number, but it hides a more interesting story. Values fell through spring and summer 2025, hit a floor of $1,133,106 in August, then climbed for six straight months. The city is essentially back where it was in March 2025 — $1,151,585 then, $1,158,667 now — after a full round trip.
If you bought at the spring 2025 peak, you’re roughly flat. If you bought in August, you’re up about 2.2% on paper in six months. The swing between high and low over the past year was about $26,000, or 2.3% of the current median.
For context, Torrance homes cost more than roughly four times the US median. That’s the Los Angeles metro premium at work — Torrance is part of the Los Angeles-Long Beach-Anaheim statistical area.
Torrance Home Prices by Neighborhood
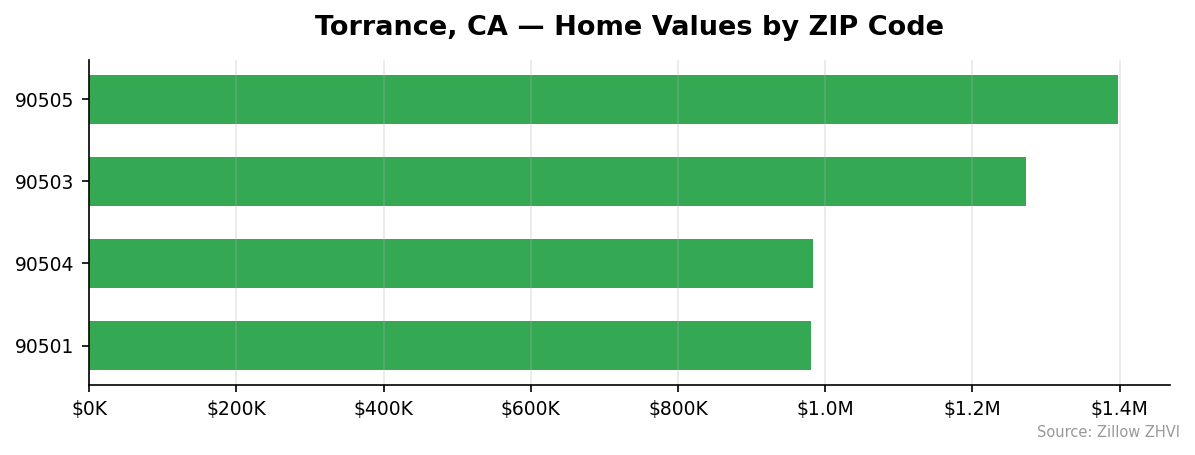
Four ZIP codes split the city into two clear tiers. The two southern ZIPs (90503 and 90505) run well above the city average. The two northern ZIPs (90501 and 90504) sit below it, and cluster tightly with each other.
| ZIP | Average Home Value | Average Rent | vs City Median |
|---|---|---|---|
| 90505 | $1,398,055 | $3,240 | +20.7% |
| 90503 | $1,272,544 | $2,881 | +9.8% |
| 90504 | $983,853 | $2,656 | −15.1% |
| 90501 | $980,218 | $2,512 | −15.4% |
Most Expensive
- 90505 leads at $1,398,055, about 21% above the Torrance median and the only ZIP with rents over $3,200.
- 90503 follows at $1,272,544, roughly $126K cheaper than 90505 but still well above the city average.
- There is no third expensive tier — prices drop sharply below 90503.
Most Affordable
- 90501 is the cheapest ZIP at $980,218, the only one under the million-dollar mark and also the lowest rent at $2,512.
- 90504 sits $3,634 higher at $983,853 — functionally identical pricing with rents about $144 higher.
- Both affordable ZIPs are still priced roughly 2.5x the US median home value, so “affordable” here is a relative term.
Rent vs Buy in Torrance
Rents across the four ZIPs average about $2,822 per month. The cheapest is 90501 at $2,512; the priciest is 90505 at $3,240.
At a $1,158,667 purchase price, the monthly carrying cost is substantially higher than rent. A 20% down payment leaves a loan around $927,000. At mortgage rates near 7%, principal and interest alone run over $6,100 per month. Add property tax (about $966 at California’s 1% effective rate) and basic insurance, and monthly ownership costs reach roughly $7,200 before maintenance.
That puts the rent-to-own gap at about $4,400 per month for a typical Torrance home.
The price-to-rent ratio tells the same story. Dividing the median value by annual rent ($2,822 × 12 = $33,864) gives a ratio of 34.2. A ratio above 20 generally favors renting on a cash-flow basis. At 34, you’re paying a steep premium to own.
That premium buys something real: equity accrual, tax deductions on mortgage interest, and protection from future rent increases. But on pure monthly math, renting wins by a wide margin in Torrance right now.
The cheapest rent-to-own comparison is in 90501, where a $2,512 rent pairs with a $980,218 home. Even there, the gap remains in the $3,000+ per month range.
Population Growth and Migration
Torrance is losing people. The city’s population dropped from 146,440 in 2020 to 139,576 in 2024, a 4.7% decline over four years.
| Year | Population |
|---|---|
| 2020 | 146,440 |
| 2021 | 143,248 |
| 2022 | 141,275 |
| 2023 | 140,111 |
| 2024 | 139,576 |
The decline has been consistent — every year since 2020 has been lower than the last. The biggest drop came between 2020 and 2021 (−3,192 residents), followed by smaller annual declines since.
That puts Torrance at odds with most other California cities covered in this data:
| City | 2024 Population | 4-Year Growth |
|---|---|---|
| Bakersfield | 417,468 | +3.0% |
| Sacramento | 535,798 | +1.9% |
| San Diego | 1,404,452 | +1.4% |
| Fresno | 550,105 | +1.4% |
| Oakland | 443,554 | +0.6% |
| Torrance | 139,576 | −4.7% |
Only Oakland comes close to flat, and it’s still growing. Torrance is the outlier.
For housing demand, a shrinking population typically caps price appreciation. That matches what the data shows: 0.6% annual price growth is well below national averages. The city’s price floor is held up by Los Angeles metro demand and limited new construction, not by population influx.
Torrance Housing Market Trends
The 12-month price path in Torrance looks like a shallow U.
| Month | Average Value |
|---|---|
| Mar 2025 | $1,151,585 |
| Apr 2025 | $1,147,431 |
| May 2025 | $1,143,119 |
| Jun 2025 | $1,136,747 |
| Jul 2025 | $1,133,325 |
| Aug 2025 | $1,133,106 |
| Sep 2025 | $1,137,779 |
| Oct 2025 | $1,144,375 |
| Nov 2025 | $1,151,171 |
| Dec 2025 | $1,157,077 |
| Jan 2026 | $1,159,337 |
| Feb 2026 | $1,158,667 |
Prices fell for five straight months from March through August 2025, bottomed at $1,133,106, then climbed for five straight months. The recovery actually reached a small peak in January 2026 at $1,159,337 before ticking down $670 in February.
Peak-to-trough, values fell 1.6%. Trough-to-current, they’ve recovered 2.3%. The net result: Torrance is up 0.6% from a year ago and essentially at a new 12-month high.
The most recent data point — February 2026 showing a slight dip — is the first month-over-month decline since August. One month isn’t a trend, but it’s worth watching.
Is Torrance a Good Place to Buy in 2026?
The data paints a mixed picture.
On the positive side, prices have stabilized and momentum has turned upward. Six of the last seven months showed gains. At $1.16M median with only modest annual appreciation, Torrance isn’t in bubble territory by California standards.
On the negative side, the rent-to-own math is brutal. Buying costs more than twice as much as renting on a monthly basis. And population is falling, which means demand isn’t driving up prices — supply constraint is.
For buyers who plan to stay long-term (7+ years) and want the tax benefits and equity build of ownership, Torrance offers a relatively stable market. For buyers who might move within 3-5 years, the math is harder to justify given the monthly carrying cost premium.
This is a buyer’s market in the sense that prices aren’t surging. But it’s a seller’s market in the sense that inventory is tight enough to prevent prices from falling meaningfully. Neither side has the clear upper hand.
Torrance Housing Market Outlook for 2026-2027
The 3-month trend suggests a plateau. January hit $1,159,337, February came in at $1,158,667 — a $670 drop that breaks a five-month upward run. Values have essentially stopped climbing.
If the current pace continues, expect prices to drift in the $1.15M to $1.17M range through summer 2026. The 12-month pattern has shown roughly $26,000 of volatility from peak to trough, so swings within that band wouldn’t be unusual.
The longer-term headwind is population decline. Torrance has lost nearly 7,000 residents since 2020, and the trend hasn’t reversed. Without population growth, price appreciation depends on regional Los Angeles demand spilling into Torrance rather than local momentum.
The six-month trend of gains may run out of steam in spring 2026 unless broader Los Angeles metro prices accelerate. The February dip is the first warning sign.
Similar Markets in CA
- Long Beach — another coastal South Bay market; often a reference point for Torrance buyers priced out of the higher 90505 ZIP.
- Los Angeles — the anchor metro; comparing city-level LA prices to Torrance helps gauge whether the South Bay premium is widening or narrowing.
- Anaheim — Orange County alternative with similar commute access to the LA core.
- Riverside — inland option for buyers willing to trade coastal access for lower prices.
- Bakersfield — the closest growing California city on this list, at 3% population growth over four years.
Frequently Asked Questions
What is the average home price in Torrance?
The average home price in Torrance, CA is $1,158,667 as of February 2026. That figure is the average across the city’s four ZIP codes using the Zillow Home Value Index, which tracks the middle tier of home values.
Are home prices going up or down in Torrance?
Prices are up 0.6% year over year — essentially flat. The market bottomed at $1,133,106 in August 2025 and has climbed about 2.3% since, though February 2026 showed the first month-over-month dip since the recovery began.
Is it cheaper to rent or buy in Torrance?
Renting is significantly cheaper on a monthly basis. Average rent is about $2,822, while estimated monthly ownership costs at the $1.16M median price run over $7,000 with mortgage, taxes, and insurance. The price-to-rent ratio of 34 favors renters.
What is the most affordable neighborhood in Torrance?
ZIP code 90501 is the cheapest at $980,218, roughly $178,000 below the city average. ZIP 90504 sits nearly identical at $983,853. Both are the only Torrance ZIPs under the million-dollar mark.
Methodology
Home values are based on the Zillow Home Value Index (ZHVI), a smoothed measure of typical home values in the 35th to 65th percentile range. Rent estimates use the Zillow Observed Rent Index (ZORI). Population figures come from the U.S. Census Bureau Population Estimates Program (2020-2024 vintage). All datasets are publicly available. Housing data updated 2026-02-28.