Thousand Oaks Home Prices: $1,063K, Down 0.3% — 3 ZIPs (2026)
$1,062,630. That’s the typical home value in Thousand Oaks as of February 2026. Prices are down 0.3% year over year — essentially flat, but the four-month climb off October’s low tells a different story.
Quick answer: The average home price in Thousand Oaks, CA is $1,062,630 as of February 2026, down 0.3% year over year according to Zillow.
Current Home Prices in Thousand Oaks
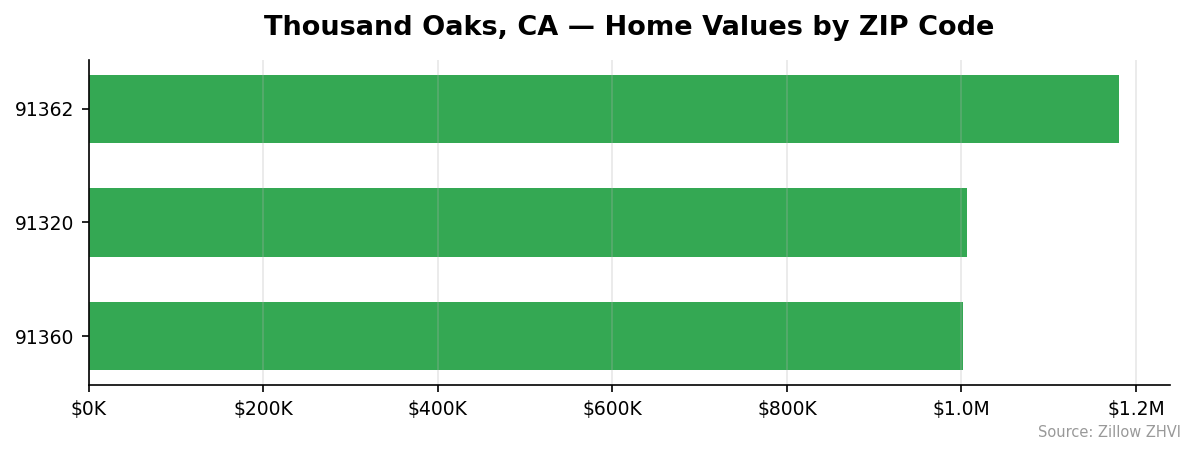
The city’s three ZIP codes show tight clustering at the seven-figure mark. The cheapest neighborhood still breaks $1 million.
| Metric | Value |
|---|---|
| Median home value | $1,062,630 |
| Year-over-year change | -0.3% |
| Lowest ZIP median | $1,001,464 (91360) |
| Highest ZIP median | $1,180,244 (91362) |
| Price spread across ZIPs | $178,780 |
| ZIPs analyzed | 3 |
| Data through | February 2026 |
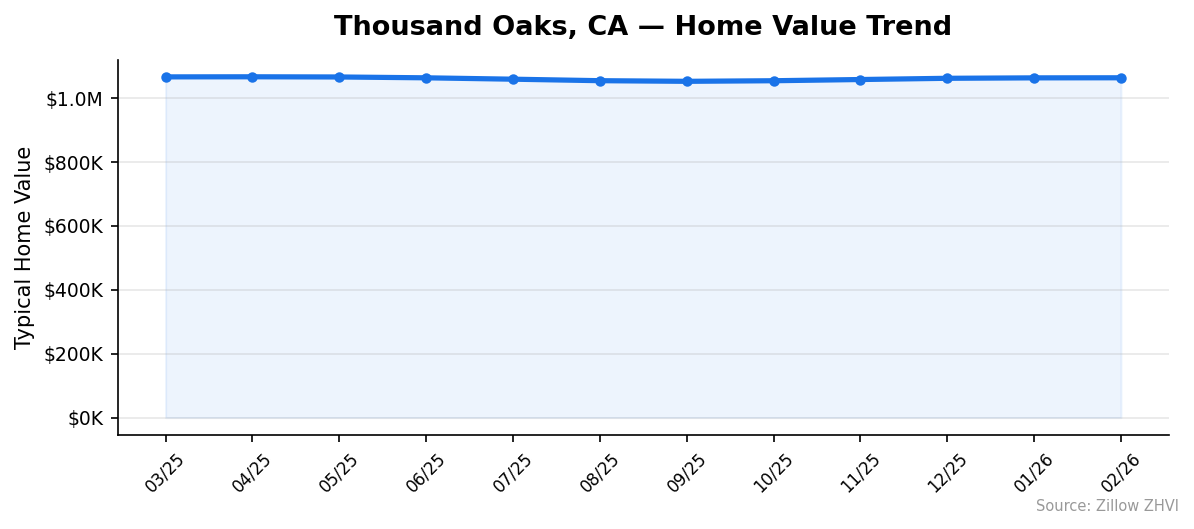
Flat on the year, but the 12-month picture hides a small recovery. Values bottomed at $1,053,380 in October 2025 and have ticked up each month since. The current $1,062,630 figure is $9,250 above that October floor — a 0.9% bounce in four months.
The spread between the city’s cheapest and priciest ZIP is $178,780, or about 18% of the low-end median. That’s narrow for a California metro. Buyers here don’t have a true “affordable” option — every corner of Thousand Oaks sits above $1 million.
One more frame of reference: Thousand Oaks homes cost roughly three times the national median, which sits near $355,000. Pay premium, get premium. But the YoY decline means you’re paying slightly less for that premium than you were a year ago.
Thousand Oaks Home Prices by Neighborhood
| ZIP Code | Median Home Value | Median Rent | vs City Avg |
|---|---|---|---|
| 91320 | $1,006,183 | $3,436 | -5.3% |
| 91360 | $1,001,464 | $3,578 | -5.8% |
| 91362 | $1,180,244 | $3,511 | +11.1% |
Most Expensive
- 91362 — $1,180,244. The priciest ZIP in Thousand Oaks, running 11% above the city average. Rent here actually sits below 91360, suggesting ownership demand — not rental demand — is what lifts prices.
With only three ZIPs, there’s no second or third tier. 91362 is the outlier on the high end.
Most Affordable
- 91360 — $1,001,464. The cheapest ZIP, but only by $4,719 over 91320. It also carries the highest rent at $3,578, which hints at steady tenant demand.
- 91320 — $1,006,183. Nearly identical pricing to 91360. Rent runs lower at $3,436, the cheapest in the city.
You can’t save real money by moving between ZIPs here. The $178,780 gap between cheapest and priciest matters less than the fact that every option starts at a million dollars.
Rent vs Buy in Thousand Oaks
Renting wins — and it isn’t close.
Average rent across the three ZIPs sits at roughly $3,508 per month. The spread is narrow: $3,436 to $3,578.
Now the buy side. Take the median home at $1,062,630. Put 20% down ($212,526). Finance $850,104 at a 7% 30-year fixed rate. Your principal and interest alone runs about $5,655 per month. Add California property taxes (around 1.1%, or $974/mo) and insurance (~$150/mo), and the carrying cost climbs past $6,780 before you patch a roof or fix a water heater.
| Cost Type | Monthly |
|---|---|
| Average rent (3 ZIPs) | $3,508 |
| Mortgage P&I (20% down, 7%) | ~$5,655 |
| Property tax + insurance | ~$1,124 |
| Total owner cost | ~$6,779 |
| Renter savings vs owner | ~$3,271/mo |
A renter pockets roughly $39,000 a year versus an owner — before considering opportunity cost on the down payment. With prices nearly flat year over year, there’s no price appreciation tailwind to close that gap. You’d need sustained annual gains of 4-5% to make ownership pencil out on cost alone.
This math flips in fast-appreciating markets. Thousand Oaks isn’t one of them right now.
Population Growth and Migration
Thousand Oaks is losing people. The 2024 Census estimate puts the population at 124,229, down from 126,814 in 2020. That’s a 2.0% drop over four years.
| Year | Population |
|---|---|
| 2020 | 126,814 |
| 2021 | 126,075 |
| 2022 | 124,728 |
| 2023 | 124,074 |
| 2024 | 124,229 |
The decline ran from 2020 through 2023, then reversed slightly in 2024 with a 155-person gain. One year doesn’t make a trend, but it’s the first positive print since the pandemic.
Compare this to other California cities:
| City | 2024 Population | 4-Year Growth |
|---|---|---|
| Thousand Oaks | 124,229 | -2.0% |
| Bakersfield | 417,468 | +3.0% |
| Sacramento | 535,798 | +1.9% |
| San Diego | 1,404,452 | +1.4% |
| Fresno | 550,105 | +1.4% |
| Oakland | 443,554 | +0.6% |
Thousand Oaks is the only California city on this list that shrunk. Inland markets like Bakersfield and Sacramento are adding residents while coastal Ventura County loses them — a pattern driven by affordability pressure.
Fewer residents means softer housing demand over time. That matches what the data shows: flat prices, not rising ones.
Thousand Oaks Housing Market Trends
The 12-month price path:
| Month | Median Value |
|---|---|
| Feb 2026 | $1,062,630 |
| Jan 2026 | $1,062,368 |
| Dec 2025 | $1,061,009 |
| Nov 2025 | $1,057,157 |
| Oct 2025 | $1,053,380 |
| Sep 2025 | $1,051,545 |
| Aug 2025 | $1,053,525 |
| Jul 2025 | $1,058,199 |
| Jun 2025 | $1,062,515 |
| May 2025 | $1,065,146 |
| Apr 2025 | $1,065,719 |
| Mar 2025 | $1,065,424 |
Two phases. Prices slipped from $1,065,424 in March 2025 down to $1,051,545 in September — a $13,879 drop over six months. Then they reversed.
From September through February, values climbed five straight months. The recovery added $11,085. That puts current prices within $2,794 of where they started a year ago.
The YoY number says -0.3%. The monthly pattern says the bottom was six months ago and buyers have been slowly bidding prices back up since then. Both can be true at once.
Is Thousand Oaks a Good Place to Buy in 2026?
The data points to a balanced — slightly buyer-leaning — market.
Arguments for buyers: prices are essentially flat year over year, the population is shrinking, and you can rent for half the monthly carrying cost of owning. Nothing about those signals screams urgency.
Arguments against: the five-month upward drift in values suggests the soft patch may be ending. If you wait for a further drop, you might be waiting out a slow climb instead.
For a primary residence where you plan to stay 7+ years, the math can work — especially if you’d otherwise keep paying $3,500/month in rent with zero equity build. For investors chasing appreciation, this market offers thin margins. A 0.9% four-month gain doesn’t cover transaction costs.
The $1 million floor matters. You need roughly $212,000 cash just to hit a 20% down payment at the cheapest ZIP. That cuts out most first-time buyers regardless of market conditions.
Thousand Oaks Housing Market Outlook for 2026-2027
The 3-month trend is gently positive. December through February added $1,621 to the median — a 0.15% move, close to flat but consistently upward.
If the current pace continues, values would add roughly 0.5-1% over the next six months. That puts prices somewhere between $1,068,000 and $1,073,000 by late summer 2026. A shallow grind higher, not a breakout.
Two things could break this pattern. A sharp rate cut would pull buyers off the sidelines and accelerate the climb. A resumption of population decline — 2024’s small gain could easily reverse — would pull demand back out. The 2022-2023 data shows this market can drop 1-2% in a short window when conditions soften.
The base case: Thousand Oaks spends 2026-2027 doing what it’s done for the past year. Drift, not drama.
Similar Markets in CA
- Oxnard — The neighboring city in the same Oxnard-Thousand Oaks-Ventura metro, useful for comparing micro-market conditions within Ventura County.
- Los Angeles — Southern California’s largest market, a reference point for whether Thousand Oaks trades at a premium or discount to the regional anchor.
- Anaheim — Another Southern California suburban market in the $1M range, for buyers weighing Orange County alternatives.
- San Diego — A coastal California comparison point with stronger population growth at +1.4%.
- Bakersfield — A cheaper inland option drawing residents from coastal markets, with +3.0% growth and far lower home prices.
Frequently Asked Questions
What is the average home price in Thousand Oaks?
The average home price in Thousand Oaks, CA is $1,062,630 as of February 2026. That figure is a median across three ZIP codes, with values ranging from $1,001,464 in 91360 to $1,180,244 in 91362.
Are home prices going up or down in Thousand Oaks?
Down 0.3% year over year — nearly flat. The short-term picture is slightly positive: values have risen for five straight months off the October 2025 low of $1,053,380, adding back about $9,250.
Is it cheaper to rent or buy in Thousand Oaks?
Renting. Average rent across the three ZIPs runs about $3,508 per month. A mortgage on the median home with 20% down at 7% interest, plus taxes and insurance, runs close to $6,780 per month — a gap of roughly $3,270.
What is the most affordable neighborhood in Thousand Oaks?
ZIP 91360 at $1,001,464, barely edging out 91320 at $1,006,183. The two cheapest ZIPs sit within $5,000 of each other and both run about 5-6% below the city average.
Methodology
Home values are based on the Zillow Home Value Index (ZHVI), a smoothed measure of typical home values in the 35th to 65th percentile range. Rent estimates use the Zillow Observed Rent Index (ZORI). Population figures come from the U.S. Census Bureau Population Estimates Program (2020-2024 vintage). All datasets are publicly available. Housing data updated 2026-02-28.