Santa Rosa Home Prices: $717K, Down 1.9% — 6 ZIPs Analyzed (2026)
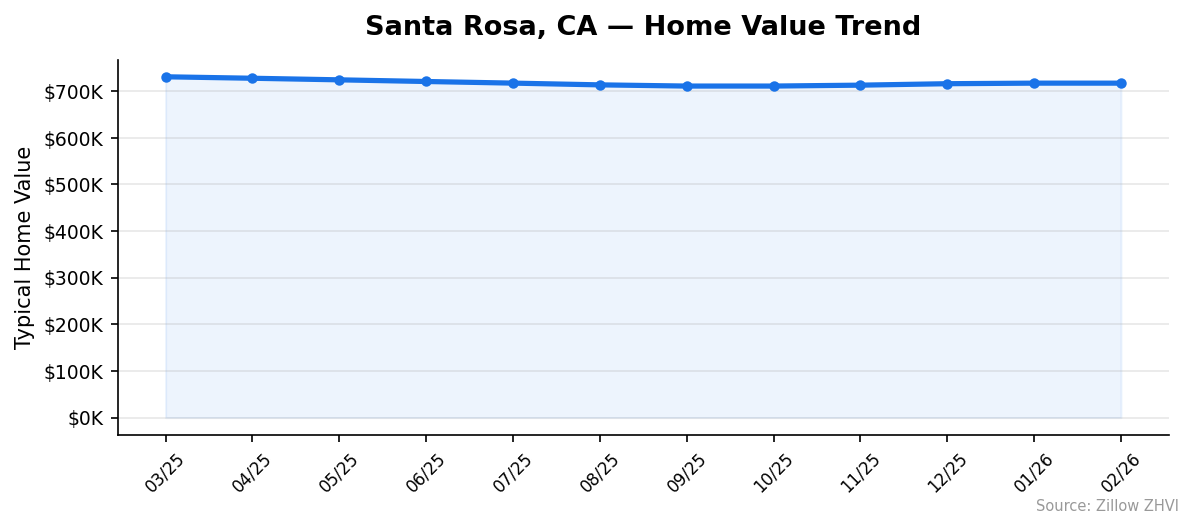
$717,119. That’s what a typical home costs in Santa Rosa right now, and the number is smaller than it was a year ago. Prices are down 1.9% year over year across the 6 ZIP codes tracked here, with the peak reading of $730,768 in March 2025 giving way to a slow slide through the back half of the year.
Quick answer: The average home price in Santa Rosa, CA is $717,119 as of February 2026, down 1.9% year over year according to Zillow.
Current Home Prices in Santa Rosa
The headline figure is $717,119. That’s the typical middle-of-the-market home value in Santa Rosa, pulled from the Zillow Home Value Index for the most recent month of data.
| Metric | Value |
|---|---|
| Median home value | $717,119 |
| Year-over-year change | -1.9% |
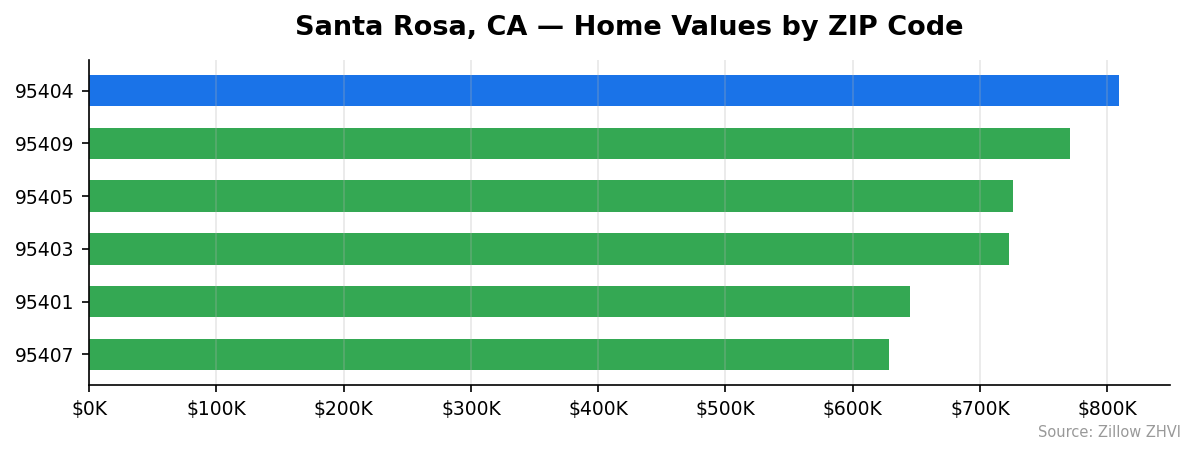
| Most expensive ZIP | 95404 ($808,926) |
| Most affordable ZIP | 95407 ($628,329) |
| Spread between ZIPs | $180,597 |
| ZIP codes analyzed | 6 |
| Data month | February 2026 |
The $180,597 gap between the priciest and cheapest ZIP is roughly 25% of the citywide median. That’s a meaningful split for a city this size. Buyers who are flexible on neighborhood can shave six figures off their purchase price without leaving Santa Rosa.
The decline tells a specific story. Twelve months ago, values were pushing toward $731,000. They’ve stepped down every month since late spring 2025, with only tiny rebounds in December and January. The February reading is essentially flat with January — $717,119 versus $717,141 — which means the bleeding has slowed even if it hasn’t reversed.
For context, the city’s values still sit well above the California median and far above most metros in the Southeast or Midwest. A 1.9% drop barely dents the affordability math for someone moving in from a cheaper market. But for a Santa Rosa owner who bought near the 2025 peak, the paper loss is real.
Santa Rosa Home Prices by Neighborhood
Here’s how the 6 Santa Rosa ZIPs compare, sorted from most to least expensive.
| ZIP Code | Median Home Value | Typical Rent |
|---|---|---|
| 95404 | $808,926 | $2,543 |
| 95409 | $771,144 | $2,678 |
| 95405 | $726,335 | $2,647 |
| 95403 | $723,190 | $2,765 |
| 95401 | $644,792 | $2,310 |
| 95407 | $628,329 | $2,618 |
Most Expensive
95404 tops the list at $808,926, about $91,800 above the city average. Despite the higher home prices, typical rent in 95404 is $2,543 — actually the second-lowest in the city, which hints at an owner-heavy area with fewer rentals on the market.
95409 comes in at $771,144, or roughly $54,000 above the Santa Rosa median, with rent near $2,678.
95405 sits at $726,335, just a hair above the city average, paired with rent of $2,647.
Most Affordable
95407 is the cheapest ZIP at $628,329, about $89,000 below the citywide median. Rent in 95407 runs $2,618 — notably high relative to the home values, which suggests stronger rental demand than the sale prices alone would imply.
95401 is next at $644,792, with the lowest rent in the city at $2,310.
95403 rounds out the affordable-ish tier at $723,190. Its rent of $2,765 is the highest of any Santa Rosa ZIP, which flips the usual pattern of cheaper homes matching cheaper rents.
Rent vs Buy in Santa Rosa
Rent across Santa Rosa averages roughly $2,594 per month, based on ZORI readings from the 6 ZIPs. The cheapest rent is in 95401 at $2,310. The priciest is in 95403 at $2,765.
Now the buy side. On the $717,119 median, put 20% down ($143,424) and finance $573,695. At a 7% rate over 30 years, principal and interest alone run about $3,818 per month. Add California property tax at 1.1% ($657/month) and basic homeowners insurance (~$150/month), and the all-in monthly payment lands near $4,625.
| Cost Type | Monthly |
|---|---|
| Typical rent (6-ZIP avg) | $2,594 |
| Mortgage P&I (20% down, 7%) | $3,818 |
| Property tax | $657 |
| Insurance (est.) | $150 |
| Total to own | $4,625 |
That’s a $2,031 monthly gap in favor of renting. On the cheap end — 95401 rent at $2,310 versus owning at the $644,792 median there — the ownership premium is similar.
Renting wins on cash flow. Buying wins if you plan to stay long enough for appreciation and principal paydown to outweigh the extra monthly spend. With prices flat-to-falling over the past 12 months, the appreciation argument is weaker than it was during the 2021-2022 run-up.
Population Growth and Migration
Santa Rosa is not growing. The city had 177,524 residents in 2024, down 0.3% from 177,972 in 2020. That’s a net loss of 448 people over four years.
| Year | Population |
|---|---|
| 2020 | 177,972 |
| 2021 | 177,338 |
| 2022 | 176,196 |
| 2023 | 176,440 |
| 2024 | 177,524 |
The bottom came in 2022, when population dipped to 176,196 — about 1,776 fewer residents than the 2020 peak. The last two years have clawed back most of that loss, but the city still hasn’t reclaimed its 2020 number.
Compare that to other California cities:
| City | 2024 Population | 4-Yr Growth |
|---|---|---|
| San Diego | 1,404,452 | +1.4% |
| Fresno | 550,105 | +1.4% |
| Sacramento | 535,798 | +1.9% |
| Oakland | 443,554 | +0.6% |
| Bakersfield | 417,468 | +3.0% |
| Santa Rosa | 177,524 | -0.3% |
Santa Rosa is the only city on this list with negative growth. Bakersfield and Sacramento are pulling residents at 3% and 1.9% clips respectively. Flat-to-shrinking population usually takes some heat off housing demand, which is consistent with the 1.9% price decline you’re seeing in the ZHVI.
Santa Rosa Housing Market Trends
The last 12 months of data show a clear peak-and-roll-over pattern.
| Month | Median Value |
|---|---|
| March 2025 | $730,768 |
| April 2025 | $727,633 |
| May 2025 | $724,234 |
| June 2025 | $720,675 |
| July 2025 | $717,189 |
| August 2025 | $713,453 |
| September 2025 | $710,893 |
| October 2025 | $710,898 |
| November 2025 | $712,825 |
| December 2025 | $715,934 |
| January 2026 | $717,141 |
| February 2026 | $717,119 |
Values fell every month from March through September 2025, shedding nearly $20,000 over six months. October was the inflection point — essentially flat at $710,898. From there, prices have ticked up four months in a row to the current $717,119.
The bounce is small. About $6,200 gained since the September low. And February actually came in $22 below January, which is as close to a true flat month as the ZHVI produces.
Read that how you want. One read: the correction is over and Santa Rosa is stabilizing around $717K. Another read: the bounce is just a seasonal blip in a longer downtrend, and prices will resume falling once spring listings hit.
Is Santa Rosa a Good Place to Buy in 2026?
The data points to a soft buyer’s market. Prices are down year over year. Population is shrinking, not growing. The rent-to-own gap is wide enough that carrying a mortgage costs nearly double what renting does. Sellers have less pricing power than they did 18 months ago.
For buyers, that means more room to negotiate. Homes that were selling at asking or above in 2024 are more likely to sit now, especially in the $750K+ ZIPs like 95404 and 95409 where the per-unit cost is steepest.
For sellers, the math is less kind. If you bought near the March 2025 peak, you’re looking at a ~1.9% paper loss before factoring in transaction costs. If you’ve owned for five-plus years, you’re still well in the green.
The flat January-to-February reading is the most useful signal in the whole dataset. It’s the clearest sign the market has found a floor, at least temporarily. Whether it holds depends on what listings and mortgage rates do through spring.
Santa Rosa Housing Market Outlook for 2026-2027
The 3-month trend suggests stabilization. Prices have moved inside a $1,300 band since December — effectively flat.
If the current pace continues, expect Santa Rosa values to hold in the $715K-$720K range through spring. The ingredients for another leg down are still here: shrinking population, negative year-over-year change, and the widest rent-versus-buy gap in years. But the month-over-month declines have stopped.
A modest spring bounce is plausible if mortgage rates ease. A renewed slide is plausible if inventory climbs and buyers keep sidelined. What the data rules out is a big upswing — you don’t get rapid appreciation from a city losing residents.
Check back in 6 months. The June 2026 reading will tell you whether February was a floor or a plateau before the next step down.
Similar Markets in CA
If Santa Rosa’s $717K median is stretching your budget, several California cities come in cheaper:
- Bakersfield — The most affordable big-city option in California, and one of the fastest-growing on this list.
- Fresno — Central Valley pricing with a much larger population base than Santa Rosa.
- Riverside — Inland Empire alternative to coastal California pricing.
- Fontana — Another Inland Empire option with lower entry prices.
If you want to stay in a similar coastal or mid-tier metro, San Diego and Long Beach are the closest apples-to-apples comparisons on the coast.
Frequently Asked Questions
What is the average home price in Santa Rosa?
The average home price in Santa Rosa, CA is $717,119 as of February 2026. That figure is the Zillow Home Value Index average across 6 ZIP codes, ranging from $628,329 in 95407 to $808,926 in 95404.
Are home prices going up or down in Santa Rosa?
Prices are down 1.9% year over year. The monthly peak was $730,768 in March 2025, and values fell through September before stabilizing. The last three months have been essentially flat near $717,000.
Is it cheaper to rent or buy in Santa Rosa?
Renting is significantly cheaper. Typical rent across the 6 ZIPs is about $2,594 per month, while owning the median $717,119 home with 20% down costs roughly $4,625 per month once you add taxes and insurance — a gap of about $2,031.
What is the most affordable neighborhood in Santa Rosa?
ZIP 95407 is the cheapest at $628,329, about $89,000 below the city average. ZIP 95401 is next at $644,792 and also has the lowest typical rent in the city at $2,310 per month.
Methodology
Home values are based on the Zillow Home Value Index (ZHVI), a smoothed measure of typical home values in the 35th to 65th percentile range. Rent estimates use the Zillow Observed Rent Index (ZORI). Population figures come from the U.S. Census Bureau Population Estimates Program (2020-2024 vintage). All datasets are publicly available. Housing data updated 2026-02-28.