Chico Home Prices: $463K, Up 1.2% — 3 ZIPs Analyzed (2026)
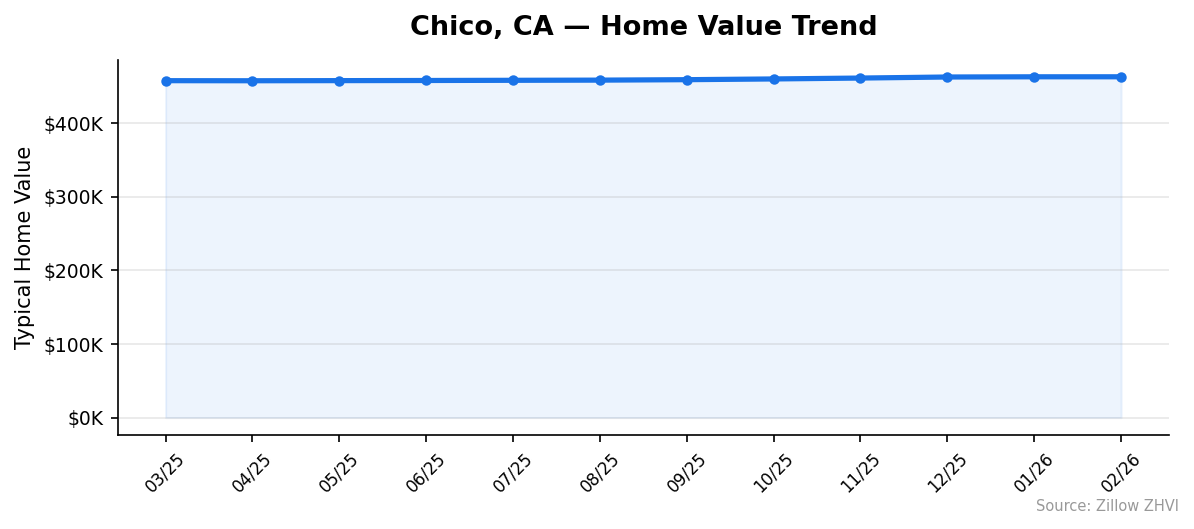
$462,882. That’s the typical home value in Chico right now, up 1.2% over the past year. After a sharp pandemic-era runup, this Northern California college town has settled into a slow, almost boring climb — eleven straight monthly increases averaging less than 0.5% each.
Quick answer: The average home price in Chico, CA is $462,882 as of February 2026, up 1.2% year over year according to Zillow.
Current Home Prices in Chico
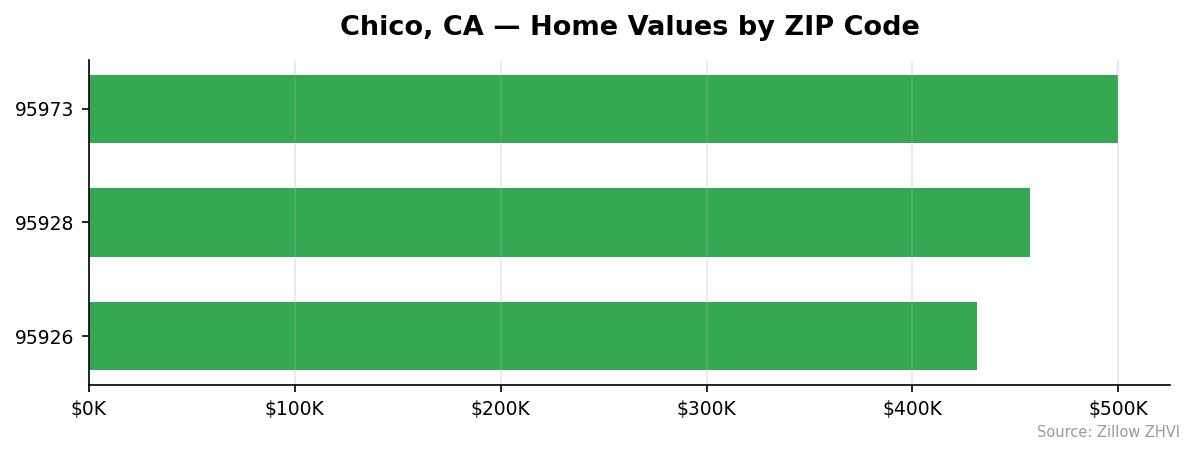
Chico is a three-ZIP city. The cheapest pocket sits at $431,240. The priciest crosses the half-million mark at $500,090. The midpoint, $462,882, is what most listings cluster around.
| Metric | Value |
|---|---|
| Median home value | $462,882 |
| Year-over-year change | +1.2% |
| Lowest ZIP | $431,240 |
| Highest ZIP | $500,090 |
| Spread (high − low) | $68,850 |
| ZIP codes analyzed | 3 |
| Data as of | February 2026 |
That 1.2% annual gain works out to about $5,500 in added equity for an average home over the past 12 months. For comparison, a typical 30-year mortgage at current rates costs more than $5,500 in interest in a single month. Appreciation is not where the math is winning right now.
The price spread between Chico’s cheapest and most expensive ZIP is just under $69,000 — narrow by California standards. In bigger metros that gap easily runs into seven figures. Chico is small enough that you can drive across it in 15 minutes, and the housing stock reflects that. There’s a top end and a bottom end, but they’re closer than the postcard photos suggest.
You’re paying a premium of roughly 7% to live in the most expensive ZIP versus the cheapest. In a city this size, that gap usually tracks newer construction, lot size, and school assignment more than dramatic neighborhood shifts.
Chico Home Prices by Neighborhood
Three ZIPs, three different price points. Here’s the full breakdown.
| ZIP Code | Typical Home Value | Avg Rent | vs City Median |
|---|---|---|---|
| 95973 | $500,090 | $1,683 | +8.0% |
| 95928 | $457,316 | $1,795 | −1.2% |
| 95926 | $431,240 | $1,461 | −6.8% |
Most Expensive
95973 — $500,090. The only ZIP in Chico above the half-million line, sitting roughly 8% above the city median. It covers the north and northwest side of town.
95928 — $457,316. Slightly below the city median but with the highest rents in town at $1,795 a month, suggesting strong demand from tenants relative to homes for sale.
95926 — $431,240. The third-priciest of three, but only because there are three.
Most Affordable
95926 — $431,240. The cheapest ZIP in Chico and home to the lowest rents at $1,461 a month. This is the ZIP that includes the Chico State campus and the older downtown core.
95928 — $457,316. South Chico territory. About $5,500 below the citywide average.
95973 — $500,090. Even the most expensive ZIP here would qualify as affordable in coastal California metros where medians clear $1 million.
Rent vs Buy in Chico
Renters are getting the better monthly deal in Chico right now. The math isn’t subtle.
Average rent across the three ZIPs comes out to about $1,646 a month. A median-priced home at $462,882 with 20% down ($92,576) leaves a $370,306 mortgage. At a 7% rate that’s roughly $2,463 in principal and interest. Add property taxes (around 1% in California, or $385/mo) and basic insurance ($150/mo), and you’re at about $3,000 a month before maintenance.
| Cost | Monthly |
|---|---|
| Average rent | $1,646 |
| Mortgage P&I (20% down, 7%) | $2,463 |
| Property taxes | $385 |
| Insurance | $150 |
| Total ownership cost | ~$2,998 |
Buying costs roughly $1,350 more per month. Then there’s the $92,576 down payment that renting doesn’t require.
The case for buying rests on appreciation and the eventual mortgage payoff. Last year’s 1.2% appreciation added about $5,500 to home values — less than half the annual cost gap between renting and owning. The math improves dramatically if you stay 7+ years and rates fall enough to refinance, or if Chico’s price growth reaccelerates. At today’s pace, renting and investing the difference is a defensible move.
ZIP 95926 narrows the gap fastest. Cheaper to buy in, cheaper to rent in.
Population Growth and Migration
Chico isn’t growing. It’s holding steady, barely.
The city had 102,911 residents in 2024, down 0.4% from 103,289 in 2020. The population dipped sharply to 100,615 in 2021 — a Camp Fire and pandemic aftershock — and has clawed back about 2,300 residents since.
| Year | Population |
|---|---|
| 2020 | 103,289 |
| 2021 | 100,615 |
| 2022 | 102,061 |
| 2023 | 102,146 |
| 2024 | 102,911 |
Compare that to other California cities and Chico is the slowest grower on the board.
| City | 2024 Pop. | 4-Year Growth |
|---|---|---|
| Bakersfield | 417,468 | +3.0% |
| Sacramento | 535,798 | +1.9% |
| San Diego | 1,404,452 | +1.4% |
| Fresno | 550,105 | +1.4% |
| Oakland | 443,554 | +0.6% |
| Chico | 102,911 | −0.4% |
Flat population means flat housing demand from migration. The 1.2% price gain came from existing residents bidding on a small inventory pool, not newcomers flooding in. That’s a fragile foundation. If interest rates stay elevated or local employment softens, prices have less ballast than in Sacramento or Bakersfield.
Chico Housing Market Trends
Twelve months. Eleven monthly increases. One flat-to-negative quarter (March-April 2025) before the slow climb resumed.
| Month | Median Value | Monthly Change |
|---|---|---|
| Feb 2026 | $462,882 | +0.0% |
| Jan 2026 | $462,866 | +0.1% |
| Dec 2025 | $462,587 | +0.3% |
| Nov 2025 | $461,166 | +0.3% |
| Oct 2025 | $459,948 | +0.2% |
| Sep 2025 | $458,953 | +0.1% |
| Aug 2025 | $458,347 | +0.1% |
| Jul 2025 | $458,105 | +0.1% |
| Jun 2025 | $457,852 | +0.0% |
| May 2025 | $457,664 | +0.0% |
| Apr 2025 | $457,497 | −0.0% |
| Mar 2025 | $457,602 | — |
The story is in the deceleration. Late 2025 saw the strongest monthly gains — November and December posted +0.3% each. By January and February 2026 that had cooled to +0.1% and effectively zero. Chico’s market hit the brakes heading into spring 2026.
The total 12-month gain of 1.2% is roughly the same magnitude as one strong month from the 2021-2022 era. This is a market in low gear.
Is Chico a Good Place to Buy in 2026?
Depends on your timeline and your alternative.
If you’re choosing between renting at $1,646 and buying at roughly $3,000 a month, the cost gap is real. With prices rising just 1.2% a year, your home isn’t going to outrun that gap quickly. A buyer breaking even on transaction costs alone usually needs 5+ years of holding.
That said, this looks more like a buyer’s market than a seller’s. Population is shrinking. Price appreciation is decelerating. The most recent two months show essentially zero monthly gains. Sellers don’t have the upper hand. If you have a strong reason to own — long-term roots, a specific home you want, kids in local schools — Chico isn’t going to overheat under you.
For investors, the rent-to-price ratio in 95928 (rent $1,795 on a $457K home) is the most interesting in the city. Still, at roughly 4.7% gross rental yield before expenses, it underperforms most cap-rate targets.
Chico Housing Market Outlook for 2026-2027
The momentum chart is flattening fast. Monthly appreciation slowed from +0.3% in late 2025 to effectively 0% by February 2026. That’s the most important number in this report.
If the current pace continues, Chico ends 2026 with a year-over-year gain in the 0-1% range — slower than the 1.2% it just posted. The 3-month trend suggests prices could plateau or dip slightly into the spring selling season, particularly if mortgage rates stay above 6.5%.
A flat-population city without an in-migration tailwind needs either falling rates or a local economic catalyst to push prices materially higher. Neither is visible in the data through February 2026. Sideways is the base case.
Similar Markets in CA
Other California cities worth comparing if Chico isn’t quite right:
- Bakersfield — the closest thing to Chico in terms of affordability profile, but with 3% population growth instead of decline.
- Fresno — larger Central Valley alternative with similar mid-state pricing and stronger demographic momentum.
- Sacramento — the closest large metro, two hours south, with state-government job stability.
- Riverside — Inland Empire option for buyers who want California weather closer to LA.
- Long Beach — coastal access for buyers willing to trade Chico’s quiet for SoCal density and a much higher price tag.
Frequently Asked Questions
What is the average home price in Chico?
The typical home in Chico, CA is worth $462,882 as of February 2026. The Zillow Home Value Index puts the city’s range from $431,240 in the cheapest ZIP (95926) to $500,090 in the priciest (95973).
Are home prices going up or down in Chico?
Prices are up 1.2% over the past year — a modest gain that lags inflation. Eleven of the last twelve months posted increases, but momentum has cooled to near zero in early 2026.
Is it cheaper to rent or buy in Chico?
Renting is cheaper by roughly $1,350 a month. Average rent runs $1,646, while a 20%-down mortgage on a median home costs about $3,000 a month including taxes and insurance.
What is the most affordable neighborhood in Chico?
ZIP 95926 is the cheapest at $431,240, about 6.8% below the citywide median. It also has the lowest rents in the city at $1,461 a month, making it the budget pick for both buyers and tenants.
Methodology
Home values are based on the Zillow Home Value Index (ZHVI), a smoothed measure of typical home values in the 35th to 65th percentile range. Rent estimates use the Zillow Observed Rent Index (ZORI). Population figures come from the U.S. Census Bureau Population Estimates Program (2020-2024 vintage). All datasets are publicly available. Housing data updated 2026-02-28.