Whittier Home Prices: $824K, Up 0.8% — 6 ZIPs Analyzed (2026)
$823,509. That’s the typical home value in Whittier, CA as of February 2026, up 0.8% from a year ago. The gain is modest, but it comes after Whittier’s population has dropped four years running.
Quick answer: The average home price in Whittier, CA is $823,509 as of February 2026, up 0.8% year over year according to Zillow.
Current Home Prices in Whittier
The Whittier housing market sits in the upper end of California’s mid-tier metros. The 0.8% annual gain trails inflation, meaning real prices have slipped slightly even as the nominal number rises.
| Metric | Value |
|---|---|
| Median home value | $823,509 |
| Year-over-year change | +0.8% |
| Most expensive ZIP | $881,824 (90603) |
| Most affordable ZIP | $763,280 (90606) |
| ZIP price range | $118,544 |
| Number of ZIPs analyzed | 6 |
| Metro area | Los Angeles-Long Beach-Anaheim |
| Data through | February 2026 |
The spread between the cheapest and priciest ZIP is about $118,000 — roughly 14% of the median. For a market this expensive, that’s a tight band. There is no extreme outlier neighborhood pulling the average up or down.
The city’s typical home costs about 2.5 times the U.S. median. You’re paying for proximity to Los Angeles and a relatively settled, low-turnover housing stock.
What the data does not show is rapid appreciation. Whittier had its peak monthly value of the past year at $823,509 — the most recent reading. The market is at a high, but it climbed there slowly, gaining roughly $19,000 over the past nine months.
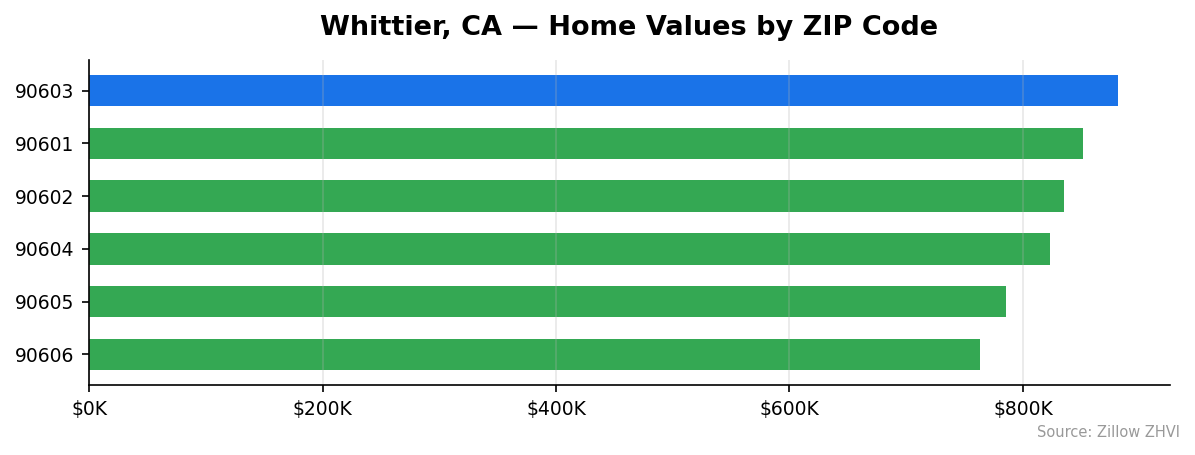
Whittier Home Prices by Neighborhood
Six ZIP codes cover Whittier and surrounding areas. Here’s how they compare.
| ZIP | Typical Home Value | vs. City Average |
|---|---|---|
| 90603 | $881,824 | +7.1% |
| 90601 | $851,225 | +3.4% |
| 90602 | $835,210 | +1.4% |
| 90604 | $823,627 | 0.0% |
| 90605 | $785,890 | -4.6% |
| 90606 | $763,280 | -7.3% |
Most Expensive ZIPs
- 90603 ($881,824) — The priciest ZIP in town, sitting 7.1% above the city average. No rent data is reported here, suggesting a heavily owner-occupied area.
- 90601 ($851,225) — The second-priciest ZIP. Rents average $2,423, the second-lowest of the four ZIPs with rent data, hinting at a stronger ownership base.
- 90602 ($835,210) — Slightly above the city average. The lowest rent reading in town at $2,283 lines up with a market tilted toward buyers rather than renters.
Most Affordable ZIPs
- 90606 ($763,280) — The cheapest ZIP, 7.3% below the city average. Despite the lower home price, rents here are the highest in Whittier at $2,517 — a sign of strong rental demand.
- 90605 ($785,890) — The second-cheapest. Rents of $2,504 sit close to 90606’s level.
- 90604 ($823,627) — Right at the city average. No rent data is reported for this ZIP.
Rent vs Buy in Whittier
The rent picture in Whittier is straightforward: it’s much cheaper than buying.
| ZIP | Avg. Rent (ZORI) |
|---|---|
| 90606 | $2,517 |
| 90605 | $2,504 |
| 90601 | $2,423 |
| 90602 | $2,283 |
Average rent across the four ZIPs with data is about $2,432 per month.
Now run the buy math. At the median price of $823,509, a 20% down payment is $164,702. Financing the remaining $658,807 at a 7% 30-year fixed rate puts principal and interest near $4,384 per month. Add property taxes (around 1.1% in Los Angeles County, roughly $755 per month), insurance, and HOA where applicable, and you’re well past $5,400 a month before maintenance.
That’s roughly $3,000 more per month than renting.
The arithmetic favors renters by a wide margin in 2026 — at least on a pure cash-flow basis. Buyers are betting on appreciation and the value of locking in housing costs against future rent increases. With prices up only 0.8% over the past year, that bet is not paying off quickly.
If you’re undecided, the breakeven point on the rent-vs-buy math depends on how long you stay. Most buyers in this price range need to hold the home for at least 7-10 years to come out ahead, given the upfront costs.
Population Growth and Migration
Whittier is losing residents. Census estimates show the population fell from 87,654 in 2020 to 85,589 in 2024, a drop of 2.4% over four years.
| Year | Population |
|---|---|
| 2020 | 87,654 |
| 2021 | 86,394 |
| 2022 | 85,755 |
| 2023 | 85,402 |
| 2024 | 85,589 |
The decline slowed in 2024 — the city actually added 187 residents that year. But the four-year trend is clearly negative.
Compare that with other California cities:
| City | 2024 Population | 4-Year Growth |
|---|---|---|
| Bakersfield | 417,468 | +3.0% |
| Sacramento | 535,798 | +1.9% |
| San Diego | 1,404,452 | +1.4% |
| Fresno | 550,105 | +1.4% |
| Oakland | 443,554 | +0.6% |
| Whittier | 85,589 | -2.4% |
Every comparison city is growing. Whittier is the outlier.
What does that mean for housing? Shrinking population usually puts downward pressure on prices over time. The fact that Whittier prices are still up 0.8% year over year suggests demand from outside the city — buyers leaving more expensive parts of LA County — is offsetting local population loss. That’s a fragile dynamic. If LA-area migration patterns shift, Whittier prices could weaken faster than the headline numbers suggest.
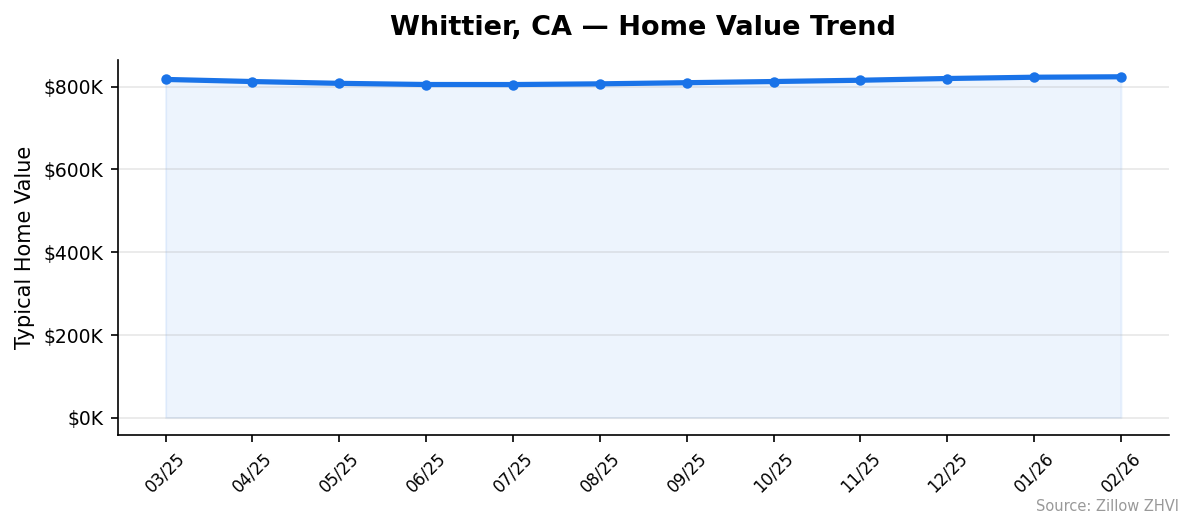
Whittier Housing Market Trends
Here’s what the past 12 months looked like.
| Month | Avg. Home Value |
|---|---|
| Mar 2025 | $817,123 |
| Apr 2025 | $812,039 |
| May 2025 | $807,684 |
| Jun 2025 | $804,875 |
| Jul 2025 | $804,774 |
| Aug 2025 | $806,480 |
| Sep 2025 | $809,241 |
| Oct 2025 | $812,064 |
| Nov 2025 | $815,180 |
| Dec 2025 | $819,350 |
| Jan 2026 | $822,454 |
| Feb 2026 | $823,509 |
Prices fell from March through July 2025, bottoming at $804,774. Since then they’ve climbed for seven straight months, adding back about $18,700 — roughly 2.3%.
The recovery has been steady, not explosive. Monthly gains have averaged around $2,700 since the summer low. February 2026 logged the smallest monthly increase of the rebound at just $1,055.
That deceleration is worth watching. The rebound may be losing steam.
Is Whittier a Good Place to Buy in 2026?
The data points to a balanced-to-slightly-soft market. Here’s the case on each side.
For buyers: Prices are up only 0.8% year over year. The population has shrunk four years in a row. Renting is dramatically cheaper than buying. None of these point to urgent buying conditions — you have time to negotiate.
For sellers: Prices have risen seven months straight. The current value is the highest of the past 12 months. Inventory in LA County remains tight. If you bought before 2020, you’re sitting on substantial gains.
The honest answer: Whittier in 2026 looks like a market where buyers hold a modest edge. Sellers no longer benefit from the bidding wars of 2021-2022. With monthly price gains slowing in early 2026, motivated sellers may need to negotiate.
If you’re a buyer, focus on ZIPs 90605 and 90606 for the best price per square foot. If you’re a seller, the data supports listing now — the rebound has run for seven months and may be closer to its top than its bottom.
Whittier Housing Market Outlook for 2026-2027
The 7-month rebound has slowed. February 2026 added just $1,055 to the typical home value, the smallest monthly gain since the recovery began.
If the current pace continues, Whittier prices would reach roughly $830,000-$835,000 by mid-2026. But the deceleration in February suggests the rebound may stall before then.
Three signals worth tracking:
- Whether monthly gains stay above $1,000 or drop toward zero
- Whether the population decline reverses further (2024 showed early signs)
- Whether broader LA County prices hold up through spring
The 12-month price range is only about $19,000 wide. Whittier is not a volatile market. Expect more of the same — small monthly moves in either direction — rather than a sharp break.
Similar Markets in CA
If you’re priced out of Whittier or want to compare, these California cities are worth a look.
- Long Beach — A larger LA County market with similar coastal proximity and price levels.
- Anaheim — An Orange County alternative for buyers who want a similar suburban feel.
- Riverside — Inland Empire pricing, typically below Whittier with more space.
- Fontana — Another Inland Empire option for buyers seeking lower entry prices.
- Los Angeles — The metro anchor; useful as a citywide benchmark for Whittier prices.
Frequently Asked Questions
What is the average home price in Whittier?
The average home price in Whittier, CA is $823,509 as of February 2026. That figure reflects typical values across six ZIP codes, with neighborhood values ranging from $763,280 in 90606 to $881,824 in 90603.
Are home prices going up or down in Whittier?
Prices are up 0.8% year over year. After dipping through mid-2025 to a low of $804,774 in July, values have climbed for seven straight months. The pace of gains slowed in February 2026, with the typical home rising just $1,055 month over month.
Is it cheaper to rent or buy in Whittier?
Renting is much cheaper. Average rent across the four ZIPs with data is about $2,432 per month. A mortgage on a median-priced $823,509 home — 20% down, 7% rate — runs over $5,400 monthly with taxes and insurance, roughly $3,000 more than renting.
What is the most affordable neighborhood in Whittier?
ZIP 90606 is the cheapest at $763,280, about 7.3% below the city average. Notably, it also has the highest rents in town at $2,517 — a sign that rental demand is strong even as home prices lag the broader Whittier market.
Methodology
Home values are based on the Zillow Home Value Index (ZHVI), a smoothed measure of typical home values in the 35th to 65th percentile range. Rent estimates use the Zillow Observed Rent Index (ZORI). Population figures come from the U.S. Census Bureau Population Estimates Program (2020-2024 vintage). All datasets are publicly available. Housing data updated 2026-02-28.