Orange Home Prices: $1,091K, Up 0.7% — 5 ZIPs Analyzed (2026)
$1,091,170. That’s the typical home price in Orange, CA as of February 2026. Prices are up 0.7% year over year and have climbed for five straight months after bottoming in September.
Quick answer: The average home price in Orange, CA is $1,091,170 as of February 2026, up 0.7% year over year according to Zillow.
Current Home Prices in Orange
Orange sits in the Los Angeles-Long Beach-Anaheim metro. The Zillow Home Value Index puts the city’s typical home at just over $1.09 million. That’s well above the national median and tracks the broader Orange County price tier.
The annual gain is small — under 1% — but it’s a gain. Many California cities are flat or down. Orange is one of the few that’s holding ground.
| Metric | Value |
|---|---|
| Median home price (Feb 2026) | $1,091,170 |
| Year-over-year change | +0.7% |
| Cheapest ZIP | $892,216 |
| Most expensive ZIP | $1,221,742 |
| Price spread across ZIPs | $329,526 |
| ZIP codes covered | 5 |
The gap between the cheapest and priciest ZIP is about $330,000. That’s a meaningful split for buyers — the most expensive part of Orange costs 37% more than the cheapest. Where you buy inside city limits matters as much as whether you buy.
You’re looking at a market that’s expensive by any national yardstick but stable. No crash. No boom. A slow drift upward.
Orange Home Prices by Neighborhood
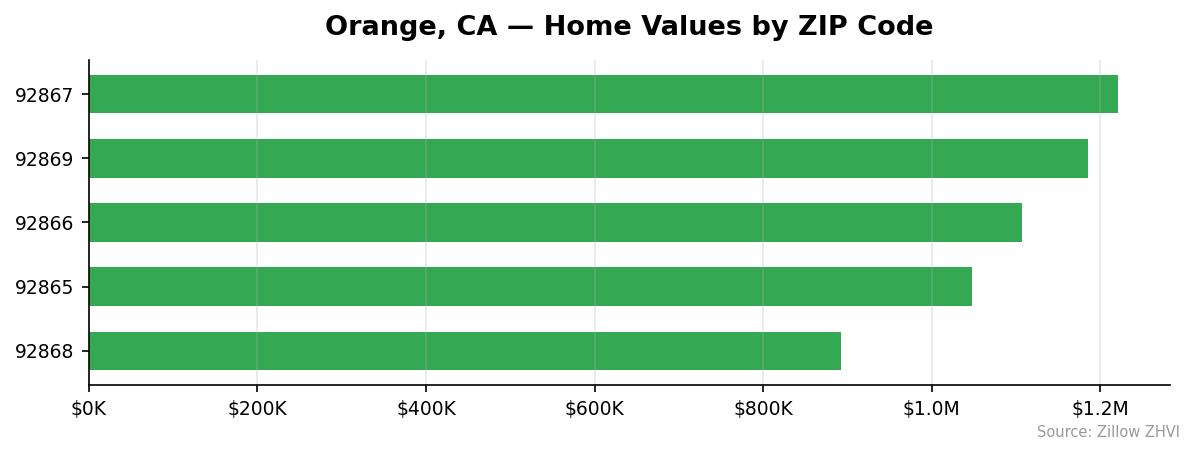
Five ZIPs make up the city. Here’s how they stack up:
| ZIP | Median Price | Monthly Rent | vs City Median |
|---|---|---|---|
| 92867 | $1,221,742 | $3,931 | +12.0% |
| 92869 | $1,186,000 | $4,033 | +8.7% |
| 92866 | $1,107,404 | $3,345 | +1.5% |
| 92865 | $1,048,490 | $3,269 | -3.9% |
| 92868 | $892,216 | $3,020 | -18.2% |
Most Expensive
92867 tops the list at $1,221,742 — 12% above the city median, with rents near $3,931 a month. 92869 follows at $1,186,000 and posts the highest rents in the city at $4,033, suggesting strong tenant demand alongside the price tag. 92866 rounds out the top three at $1,107,404, sitting just above the citywide average.
Most Affordable
92868 is the only ZIP under $1 million, at $892,216 — that’s $199,000 below the city median and rents are also the lowest at $3,020. 92865 comes in next at $1,048,490, the only other ZIP below the citywide median. 92866 is the third cheapest but still slightly above the median, showing how compressed the bottom of the Orange market is.
Rent vs Buy in Orange
Average rent across the five ZIPs works out to about $3,520 a month. The cheapest is 92868 at $3,020. The most expensive is 92869 at $4,033.
Now run the buy-side math. A median home at $1,091,170 with 20% down leaves an $873,000 loan. At today’s rates, principal and interest alone run close to $5,800 a month. Add property taxes around 1.1% in California and insurance, and you’re looking at roughly $7,000 a month before maintenance.
That’s nearly double the typical rent.
| Cost | Monthly |
|---|---|
| Average rent (ZORI) | ~$3,520 |
| Estimated mortgage (20% down, median price) | ~$7,000 |
| Renter savings | ~$3,480/month |
For a buyer, that gap has to be made up by appreciation, tax benefits, and the lack of rent inflation. With Orange prices growing under 1% a year, appreciation isn’t doing the heavy lifting right now. Renting wins on cash flow. Buying still wins on stability and long-term equity — but you pay for that today.
If you can rent in 92868 for $3,020 while saving the difference, you’re banking real money against a market that’s barely moving.
Population Growth and Migration
Orange is losing residents. The city had 139,481 people in 2020. By 2024, that fell to 137,941 — a 1.1% drop over four years.
| Year | Population |
|---|---|
| 2020 | 139,481 |
| 2021 | 137,834 |
| 2022 | 137,886 |
| 2023 | 138,246 |
| 2024 | 137,941 |
The drop happened mostly in 2021. Population stabilized through 2023, then dipped slightly again last year. This isn’t collapse, but it’s not growth either.
Compare that to other California cities:
| City | 2024 Population | 4-Year Growth |
|---|---|---|
| Bakersfield | 417,468 | +3.0% |
| Sacramento | 535,798 | +1.9% |
| San Diego | 1,404,452 | +1.4% |
| Fresno | 550,105 | +1.4% |
| Oakland | 443,554 | +0.6% |
| Orange | 137,941 | -1.1% |
Every comparison city is growing. Orange is the outlier.
For the housing market, that flat-to-shrinking population is part of why prices are barely moving. Demand isn’t being pushed up by an inflow of new residents. What’s holding prices up is constrained supply and the broader Orange County premium — not local growth.
Orange Housing Market Trends
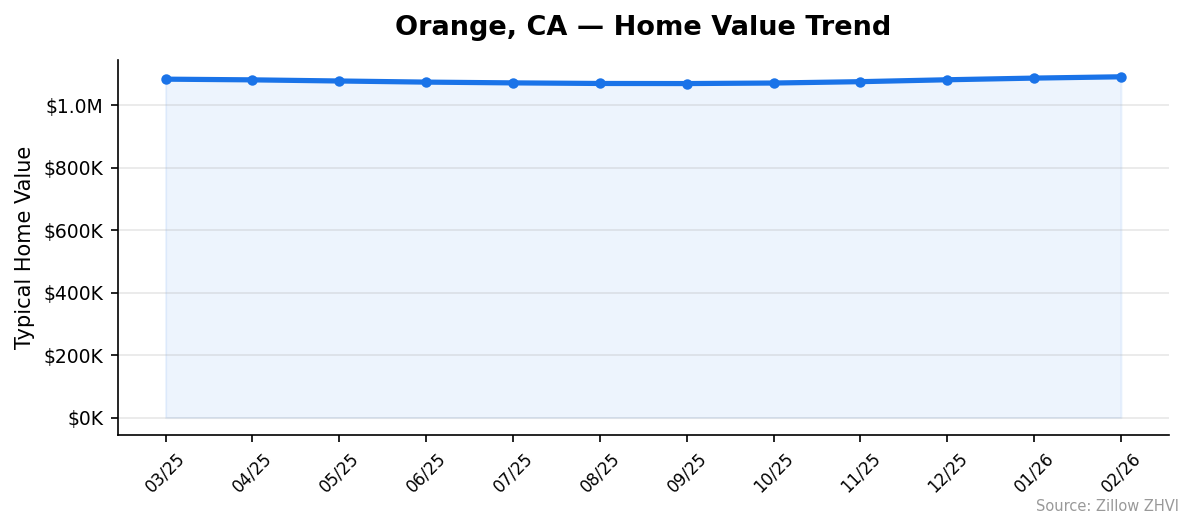
Twelve months of price data tells the story:
| Month | Median Price |
|---|---|
| Mar 2025 | $1,083,572 |
| Apr 2025 | $1,081,360 |
| May 2025 | $1,077,707 |
| Jun 2025 | $1,074,121 |
| Jul 2025 | $1,071,668 |
| Aug 2025 | $1,069,771 |
| Sep 2025 | $1,069,505 |
| Oct 2025 | $1,071,187 |
| Nov 2025 | $1,075,529 |
| Dec 2025 | $1,081,648 |
| Jan 2026 | $1,086,962 |
| Feb 2026 | $1,091,170 |
Two phases. Prices fell from March through September 2025, dropping about $14,000 over six months. Then they reversed.
From the September trough to February 2026, the market gained roughly $21,600 — a 2.0% climb in five months. Each of the last five readings has been higher than the one before. The annual figure of +0.7% understates what’s happening in the recent data.
Buyers who waited through the summer slump caught a brief window. That window is closing.
Is Orange a Good Place to Buy in 2026?
Right now this leans seller. Five straight months of gains, low inventory pressure typical of California metros, and a price floor that held at $1.07 million during the soft patch.
But the case isn’t overwhelming. Year-over-year growth is under 1%. Population is shrinking. Rents in 92868 at $3,020 a month make renting genuinely competitive against a $7,000-a-month mortgage.
A buyer in Orange in 2026 is paying for location, schools, and Orange County stability — not for fast appreciation. The price tag of $1.09 million doesn’t come with a guarantee of capital gains. It comes with reliability.
If you need to buy here — for work, family, or schools — the data says wait-and-see won’t help much. The dip is over. If you’re flexible, the rent gap is wide enough to justify staying a tenant for now and watching whether the recent uptick continues or stalls.
Orange Housing Market Outlook for 2026-2027
The 3-month trend shows clear upward momentum. Prices rose $9,522 from December to February — about 0.9% over two months. If the current pace continues, Orange could cross $1.10 million by mid-2026.
That’s a big “if.” The same data series fell for six months last year before reversing. Seasonal patterns matter here. Spring typically brings buyers, and the recent climb may reflect early spring demand more than a durable trend.
A reasonable read: the next 3 to 6 months should stay positive based on current momentum, but the rate of gain may flatten if population continues drifting down and rates stay elevated. A return to the September lows would require a fresh shock — there’s no signal of that in the trend data.
Annual growth of 1% to 2% looks plausible if the current direction holds.
Similar Markets in CA
If $1.09 million is more than your budget can stretch, California has cheaper options inside the same state:
- Bakersfield — sits well below Orange and is one of the few California cities still adding residents.
- Fresno — Central Valley pricing at a fraction of Orange County rates.
- Riverside — closer to Orange geographically, with lower entry prices.
- Long Beach — coastal alternative inside the same metro.
- Anaheim — neighbor city in Orange County with similar amenities.
Frequently Asked Questions
What is the average home price in Orange?
The average home price in Orange, CA is $1,091,170 as of February 2026. That figure comes from the Zillow Home Value Index across the city’s five ZIP codes. The cheapest ZIP runs $892,216 and the priciest hits $1,221,742.
Are home prices going up or down in Orange?
Up. Prices rose 0.7% over the past year and have climbed for five months in a row from a September 2025 low of $1,069,505. The recent 3-month pace is faster than the annual figure suggests.
Is it cheaper to rent or buy in Orange?
Renting. Average rent runs about $3,520 a month. A mortgage on the median home with 20% down costs roughly $7,000 a month including taxes and insurance — nearly double the rent. The buy case rests on long-term appreciation and equity, not monthly cash flow.
What is the most affordable neighborhood in Orange?
ZIP 92868 at $892,216. It’s the only ZIP under $1 million and runs $199,000 below the city median. Rents there are also the lowest at $3,020 a month, making it the cheapest entry point for both buyers and tenants.
Methodology
Home values are based on the Zillow Home Value Index (ZHVI), a smoothed measure of typical home values in the 35th to 65th percentile range. Rent estimates use the Zillow Observed Rent Index (ZORI). Population figures come from the U.S. Census Bureau Population Estimates Program (2020-2024 vintage). All datasets are publicly available. Housing data updated 2026-02-28.