Woodland Home Prices: $520K, Down 3.4% — 3 ZIPs Analyzed (2026)
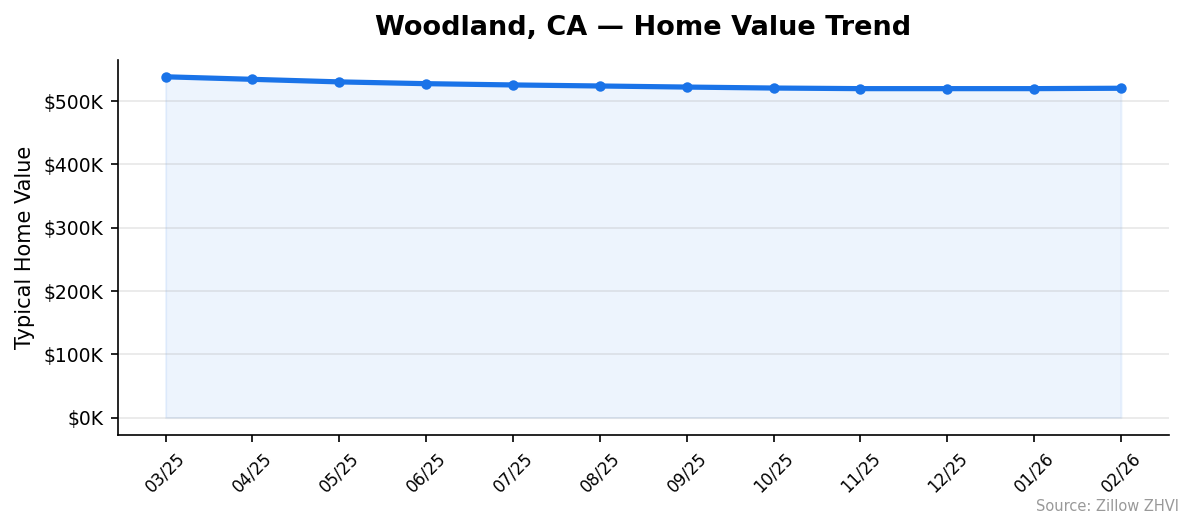
$520,112. That is the typical home value in Woodland, CA as of February 2026. Prices are down 3.4% from a year ago, and the slide has continued every month since spring 2025.
Quick answer: The average home price in Woodland, CA is $520,112 as of February 2026, down 3.4% year over year. The city has three Zillow-tracked ZIP codes ranging from $448,282 to $597,721.
Current Home Prices in Woodland
The Woodland market has cooled. Twelve months ago the median sat at $538,214. Today it is $520,112. That is roughly $18,000 in lost value for the typical homeowner.
| Metric | Value |
|---|---|
| Median home value | $520,112 |
| Year-over-year change | −3.4% |
| Lowest ZIP value | $448,282 (95937) |
| Highest ZIP value | $597,721 (95776) |
| Price spread across ZIPs | $149,439 |
| ZIP codes tracked | 3 |
| Metro area | Sacramento-Roseville-Folsom |
| Data through | February 2026 |
The spread between the cheapest and priciest ZIP is $149,439. That is a 33% gap. For a city of about 63,000 people, that is a wide neighborhood split.
You should read the headline carefully. A 3.4% decline does not mean every home lost value. The min-max range across ZIPs has actually narrowed slightly over the past year — the top ZIP fell harder than the bottom one. In March 2025 the gap was $113,210. Today it is $149,439. So the cheapest ZIP has held value better than the priciest.
Sacramento metro is a relevant frame. Woodland is the seat of Yolo County and sits roughly 20 miles northwest of Sacramento. Prices here track the broader regional pullback that has hit the I-80 corridor since rates climbed.
Woodland Home Prices by Neighborhood
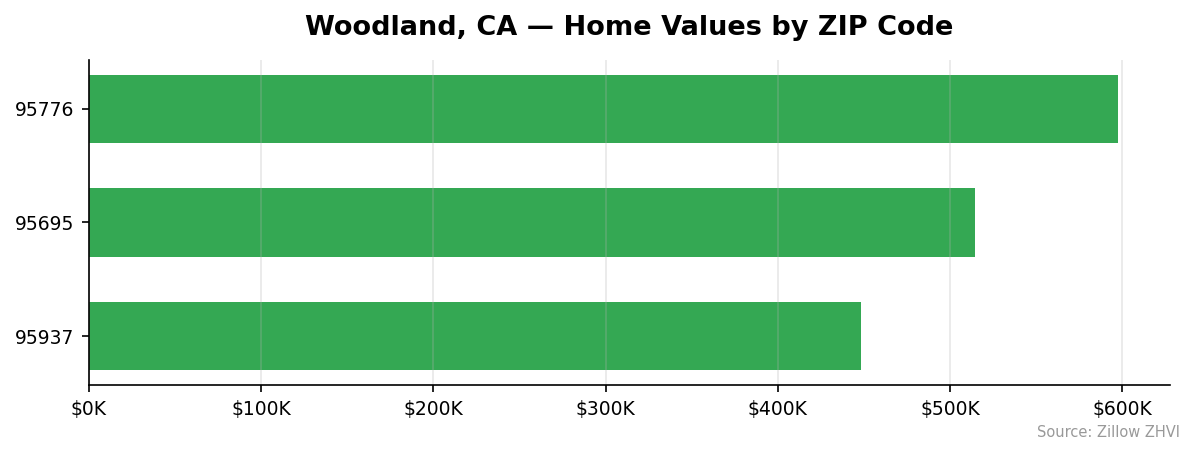
Three ZIP codes cover the city. Each one tells a different story.
| ZIP | Median value | Avg rent (ZORI) | vs city median |
|---|---|---|---|
| 95776 | $597,721 | $2,865 | +14.9% |
| 95695 | $514,334 | $1,888 | −1.1% |
| 95937 | $448,282 | n/a | −13.8% |
Most Expensive
- 95776 — $597,721. This is the priciest ZIP in the city, $77,609 above the Woodland median, and rents are also the highest at $2,865.
- 95695 — $514,334. This is the middle ZIP, sitting just $5,778 below the city average. Rent runs $1,888.
- 95937 — $448,282. Even the bottom ZIP carries a price that would buy a much larger home in most of the country.
Most Affordable
- 95937 — $448,282. The cheapest entry point in Woodland. No ZORI rent data is published for this ZIP.
- 95695 — $514,334. Mid-tier value with the lower rent of the two ZIPs that have data — about $977 less per month than 95776.
- 95776 — $597,721. Even the most expensive ZIP is below California metro hubs like San Diego or Anaheim.
If you are buying, the choice between 95937 and 95776 is a $149,439 question.
Rent vs Buy in Woodland
Two of the three Woodland ZIPs report rent. The numbers help you size up the trade.
| ZIP | Median rent | Annual rent | Median home price |
|---|---|---|---|
| 95776 | $2,865 | $34,380 | $597,721 |
| 95695 | $1,888 | $22,656 | $514,334 |
Take the city median price of $520,112. With 20% down, you finance $416,090. At a 6.75% 30-year fixed rate that is about $2,698 a month in principal and interest. Add property tax (California averages around 0.74% of assessed value, or roughly $321 a month) and homeowner insurance (call it $150). You are at about $3,169 per month before any HOA or maintenance.
Rent in 95695 at $1,888 is $1,281 cheaper than that. Rent in 95776 at $2,865 is $304 cheaper. So renting wins on monthly cash outlay in both ZIPs that have rent data.
That is just cash flow. Mortgage payments build equity. Rent does not. With prices down 3.4% over the past year, the equity argument has weakened — a buyer who closed in early 2025 is currently underwater on appreciation. If you plan to stay seven or more years, the math usually flips back toward buying. Under three years, renting is the safer call right now.
Population Growth and Migration
Woodland is gaining residents. The city counted 62,983 people in 2024, up from 60,967 in 2020. That is a 3.3% gain in four years.
| Year | Population |
|---|---|
| 2020 | 60,967 |
| 2021 | 61,366 |
| 2022 | 61,972 |
| 2023 | 61,987 |
| 2024 | 62,983 |
Growth was nearly flat between 2022 and 2023, then jumped by almost 1,000 people in the most recent year. The trajectory is positive, just uneven.
How does that compare with other California cities?
| City | 2024 population | 4-year growth |
|---|---|---|
| Bakersfield | 417,468 | 3.0% |
| Woodland | 62,983 | 3.3% |
| Sacramento | 535,798 | 1.9% |
| San Diego | 1,404,452 | 1.4% |
| Fresno | 550,105 | 1.4% |
| Oakland | 443,554 | 0.6% |
Woodland’s 3.3% rate beats every major California city in this sample. That is unusual for a state where many large cities have struggled to add residents. The Sacramento metro has been one of the few growth pockets in California, and Woodland is participating in that trend.
For housing demand, growth is supportive. Falling prices plus rising population usually points to an affordability adjustment, not a demand collapse.
Woodland Housing Market Trends
The 12-month picture is one of steady, monthly declines.
| Month | Median value | Min ZIP | Max ZIP |
|---|---|---|---|
| March 2025 | $538,214 | $490,958 | $604,168 |
| April 2025 | $534,204 | $480,797 | $602,848 |
| May 2025 | $530,154 | $470,372 | $601,466 |
| June 2025 | $527,344 | $463,776 | $600,325 |
| July 2025 | $525,338 | $461,338 | $598,518 |
| August 2025 | $523,691 | $460,462 | $596,703 |
| September 2025 | $521,984 | $458,150 | $595,128 |
| October 2025 | $520,442 | $454,464 | $594,593 |
| November 2025 | $519,499 | $451,091 | $594,681 |
| December 2025 | $519,494 | $449,060 | $595,880 |
| January 2026 | $519,508 | $447,819 | $596,809 |
| February 2026 | $520,112 | $448,282 | $597,721 |
Read the bottom of the table. The slide stopped in November. December was flat. January was up $14. February was up $604. That is not a recovery yet, but it is a pause. The largest monthly drops were in early 2025, when prices fell roughly $4,000 a month. The market has now spent four straight months within a $1,000 band.
The min-ZIP figure (95937) bottomed in January at $447,819 and ticked up in February. The max-ZIP figure (95776) bottomed in November at $594,681 and has gained $3,040 since.
Is Woodland a Good Place to Buy in 2026?
The data points to a soft buyer’s market that may be turning.
Arguments for buying:
- Prices are down 3.4% from a year ago. You are not buying at the peak.
- The four-month decline has stalled. Median value has held in a narrow range since November.
- The population is growing 3.3% over four years, faster than Sacramento, San Diego, Oakland, and Fresno.
- ZIP 95937 at $448,282 is well below California metro averages.
Arguments for waiting:
- Rent is cheaper than a typical mortgage by $300 to $1,300 a month, depending on ZIP.
- The annual change is still negative, so you could see another small decline before any rebound.
- The cheapest ZIP, 95937, fell harder year over year than the priciest, 95776, suggesting the bottom is still finding its footing.
If you need a home now and plan to stay five-plus years, the recent flattening is a reasonable entry signal. If you are flexible on timing, watching the next two months for a confirmed reversal in the median is sensible.
Woodland Housing Market Outlook for 2026-2027
The 3-month trend suggests prices have stopped falling. December through February showed total movement of $618 — essentially flat. That is a sharp departure from the $3,000-to-$4,000 monthly drops in the first half of 2025.
If the current pace continues, Woodland enters spring 2026 stable rather than declining. Whether that turns into outright price growth depends on whether the recent population uptick (the 996-person gain from 2023 to 2024) holds and whether mortgage rates ease.
Two scenarios worth tracking:
- The flat trend extends through summer 2026. Year-over-year comparisons would then move from −3.4% toward zero by autumn as the bigger early-2025 drops roll off.
- A second leg down begins. The min-ZIP bottoming in January and bouncing in February argues against this, but a single month is not a trend.
The most likely outcome based on the visible data: a low single-digit move in either direction over the next 6 months, with the prior decline easing.
Similar Markets in CA
If you are weighing Woodland against other California cities, these markets sit in the same state:
- Sacramento is the natural comparison — Woodland is part of its metro and shares the same buyer pool.
- Bakersfield has nearly identical 4-year population growth (3.0% vs Woodland’s 3.3%) but a lower price base.
- Fresno offers a Central Valley alternative with slower 1.4% population growth.
- Riverside gives buyers a Southern California option in a different metro.
- Long Beach shifts you to the LA coast for a price comparison.
Frequently Asked Questions
What is the average home price in Woodland?
The average home price in Woodland, CA is $520,112 as of February 2026. That number is the Zillow Home Value Index for the city, blending data from three ZIP codes (95695, 95776, and 95937).
Are home prices going up or down in Woodland?
Down. Prices fell 3.4% over the past 12 months, dropping from $538,214 in March 2025 to $520,112 in February 2026. The decline has flattened in the last four months, with the median moving less than $1,000 since November.
Is it cheaper to rent or buy in Woodland?
Renting is cheaper month to month. Average rent in ZIP 95695 is $1,888 and in 95776 is $2,865, while a typical mortgage on the $520,112 median price runs about $3,169 with taxes and insurance. Buying still wins long-term if you stay seven or more years.
What is the most affordable neighborhood in Woodland?
ZIP 95937 is the cheapest at $448,282, about $72,000 below the city median and $149,000 below the priciest ZIP, 95776. It is also the only Woodland ZIP without published Zillow rent data.
Methodology
Home values are based on the Zillow Home Value Index (ZHVI), a smoothed measure of typical home values in the 35th to 65th percentile range. Rent estimates use the Zillow Observed Rent Index (ZORI). Population figures come from the U.S. Census Bureau Population Estimates Program (2020-2024 vintage). All datasets are publicly available. Housing data updated 2026-02-28.