Inglewood Home Prices: $737K, Up 0.9% — 5 ZIPs Analyzed (2026)
$736,829. That’s what a typical home costs in Inglewood right now, and the price is up 0.9% from a year ago. After a soft summer, the market has quietly added about $28,000 to the median since July.
Quick answer: The average home price in Inglewood, CA is $736,829 as of February 2026, up 0.9% year over year according to Zillow.
Current Home Prices in Inglewood
The numbers are tight. Inglewood’s typical home value sits at $736,829, with neighborhood medians ranging from $668,598 on the low end to $817,257 on the high end. That’s a $148,659 spread between the cheapest and most expensive ZIPs — about 22% of the city median.
| Metric | Value |
|---|---|
| Median home price | $736,829 |
| Year-over-year change | +0.9% |
| Cheapest ZIP median | $668,598 |
| Most expensive ZIP median | $817,257 |
| ZIP codes tracked | 5 |
| Data through | February 2026 |
A 0.9% gain is barely keeping pace with inflation. For sellers, that means equity growth has stalled compared to the double-digit jumps Inglewood saw earlier this decade. For buyers, it means the panic-buying era is over — homes are not appreciating fast enough to outrun a 30-year mortgage rate.
The price floor is the more interesting story. Even the cheapest ZIP in Inglewood crosses $668,000. There is no bargain bin here. If you want to buy in this city, you are paying high six figures regardless of which neighborhood you pick.
Inglewood’s median runs well above the Los Angeles-Long Beach-Anaheim metro pattern for working-class submarkets. SoFi Stadium, the Intuit Dome, and proximity to LAX have kept demand steady even as the broader California market cools.
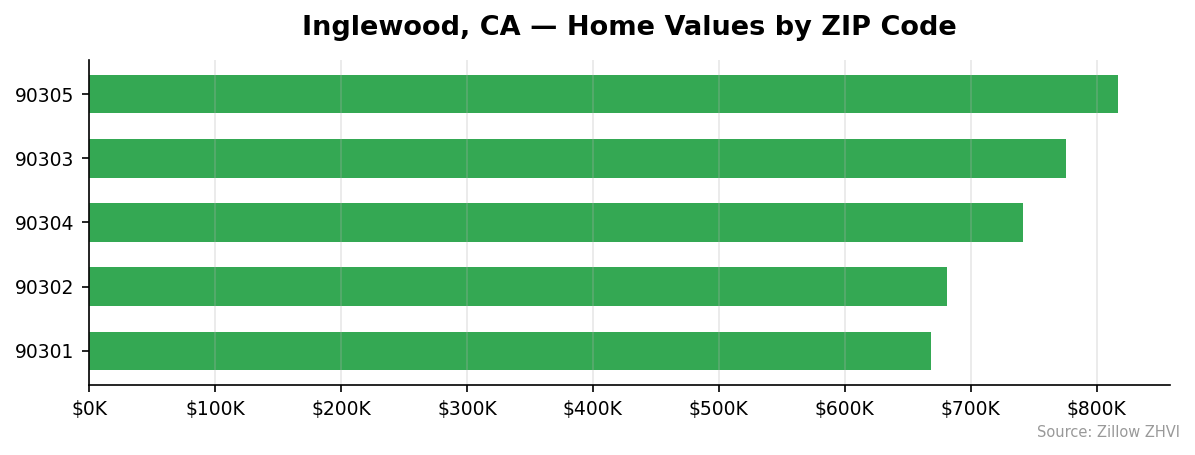
Inglewood Home Prices by Neighborhood
Five ZIPs, five different price tiers. The city splits cleanly between its eastern edges and its central core.
| ZIP | Median Home Value | Median Rent | vs City Avg |
|---|---|---|---|
| 90305 | $817,257 | $2,579 | +10.9% |
| 90303 | $775,764 | $2,193 | +5.3% |
| 90304 | $741,276 | $2,899 | +0.6% |
| 90302 | $681,252 | $2,320 | -7.5% |
| 90301 | $668,598 | $2,612 | -9.3% |
Most Expensive
90305 tops the list at $817,257 — about $80,000 above the city average. This area runs along the southern edge of Inglewood and commands the largest premium.
90303 comes in second at $775,764, roughly $39,000 above the city median. Rent here is the lowest of any ZIP at $2,193, suggesting a buyer-heavy submarket.
90304 sits closest to the city average at $741,276 but pulls the highest rent in town at $2,899 a month.
Most Affordable
90301 is the cheapest at $668,598, about $68,000 below the city average. Rent runs $2,612 — high relative to the home value, which can make this ZIP attractive to investors.
90302 is second-cheapest at $681,252. The rent-to-price ratio is the weakest in town.
90304 rounds out the more affordable half at $741,276 and offers the strongest rental income of any ZIP.
Rent vs Buy in Inglewood
The math heavily favors renting in Inglewood right now.
Median rent across the five ZIPs averages about $2,520 a month. A mortgage on the $736,829 median home — assuming 20% down and a 30-year fixed at recent rates — runs north of $4,500 a month before property taxes, insurance, or maintenance. Add those in and you are over $5,500 monthly.
| Housing Cost | Monthly |
|---|---|
| Average rent | ~$2,520 |
| Estimated mortgage (20% down) | $4,500+ |
| Difference | ~$2,000+ |
Renters in Inglewood save roughly $2,000 a month versus buyers. Over five years, that gap compounds to more than $120,000 — enough to fund the down payment elsewhere or invest in the market.
The rent-to-price ratio varies sharply by ZIP. 90304 produces $2,899 in rent on a $741,276 home. 90303 produces only $2,193 on a $775,764 home. If you are an investor running cash-flow math, those two ZIPs are not the same deal even though the home prices are within $35,000 of each other.
For owner-occupants, the buy case rests on appreciation. With prices up only 0.9% over the past year, the appreciation argument is weak. You would need at least 4-5% annual growth to offset the rent-versus-own gap.
Population Growth and Migration
Inglewood is losing residents.
| Year | Population |
|---|---|
| 2020 | 107,398 |
| 2021 | 105,286 |
| 2022 | 104,175 |
| 2023 | 103,346 |
| 2024 | 102,774 |
The city has shed 4,624 residents since 2020 — a 4.3% decline. The drop is steady, not a one-year blip. Every year from 2020 to 2024 posted a loss.
That puts Inglewood out of step with the rest of California:
| City | 2024 Population | 4-Yr Growth |
|---|---|---|
| Bakersfield | 417,468 | +3.0% |
| Sacramento | 535,798 | +1.9% |
| San Diego | 1,404,452 | +1.4% |
| Fresno | 550,105 | +1.4% |
| Oakland | 443,554 | +0.6% |
| Inglewood | 102,774 | -4.3% |
Every comparable California city in this group is growing. Inglewood is the outlier on the wrong side. Population loss eventually shows up in housing demand. The fact that prices are still rising despite a shrinking population suggests demand is being driven by buyers from outside Inglewood — investors, commuters, renters priced out of nearby Westside neighborhoods — rather than organic growth from within.
Inglewood Housing Market Trends
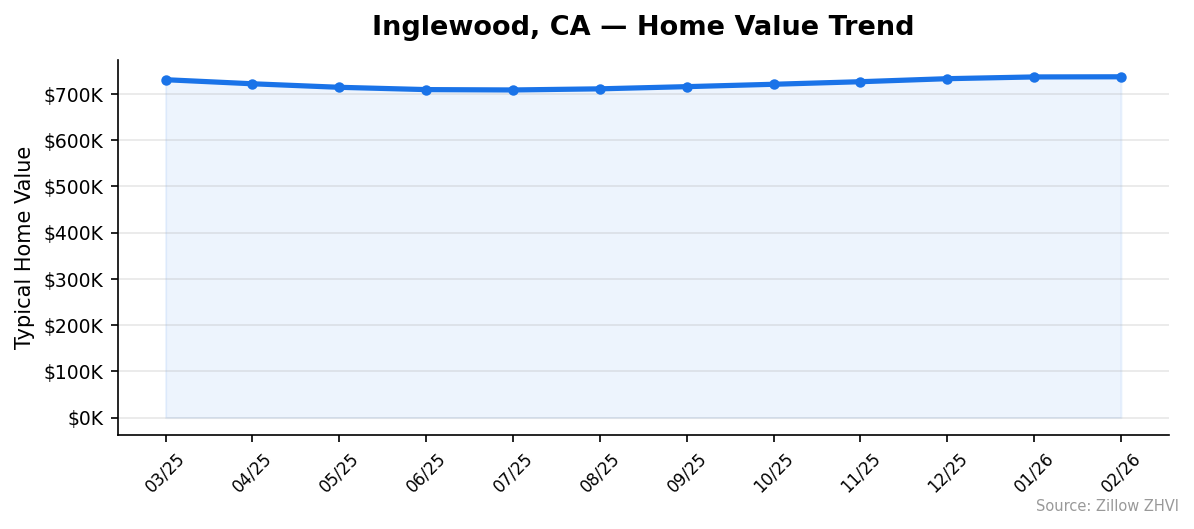
Twelve months of data shows a U-shaped curve.
| Month | Median Value |
|---|---|
| Mar 2025 | $730,520 |
| Apr 2025 | $721,722 |
| May 2025 | $714,106 |
| Jun 2025 | $709,139 |
| Jul 2025 | $708,342 |
| Aug 2025 | $710,781 |
| Sep 2025 | $715,508 |
| Oct 2025 | $720,651 |
| Nov 2025 | $726,176 |
| Dec 2025 | $732,733 |
| Jan 2026 | $736,505 |
| Feb 2026 | $736,829 |
Prices fell from March through July 2025, bottoming at $708,342. Since then, the market has added $28,487 in seven months — roughly 4% off the low.
The recovery has slowed lately. December to February gained only $4,096 combined. That is a deceleration from the $5,000-to-$7,000 monthly jumps seen in October and November.
The full 12-month picture is small gains masking a meaningful midyear drawdown. If you bought at the March 2025 peak, you are still slightly underwater. If you bought at the July low, you have made a clean 4%.
Is Inglewood a Good Place to Buy in 2026?
The data points to a flat market with a slight buyer advantage.
A 0.9% YoY gain is essentially a stalled market — prices are not crashing, but they are not rewarding new buyers either. Combined with a shrinking population and a rent-to-buy gap of $2,000 a month, the case for buying right now rests on personal factors: you want stability, you have cash, you plan to stay 7+ years.
For investors, the rent yields are weak. A $2,520 average rent on a $736,829 home produces a 4.1% gross yield before expenses. After taxes, insurance, vacancy, and maintenance, real returns are likely under 2%.
The exception is 90304. Strong rents on moderately priced homes give it the best cash-flow profile in the city. ZIPs 90302 and 90303 produce the weakest rental returns and lean toward speculative appreciation plays.
Sellers should price realistically. The recent slowdown in monthly gains suggests the easy money has been made.
Inglewood Housing Market Outlook for 2026-2027
The 3-month trend suggests further deceleration. Inglewood added $4,096 from December to February — well below the $6,500 average monthly gain from the prior fall recovery period.
If the current pace continues, prices land somewhere in the $740,000 to $745,000 range by mid-2026. That is a modest 1-2% gain from current levels.
The downside risk is the population decline. Four straight years of losses eventually pressure pricing. The upside risk is the SoFi Stadium effect — major event venues continue drawing investment to the area, and the broader Los Angeles-Long Beach-Anaheim metro remains supply-constrained.
Watch the next two months. If March and April 2026 print flat or negative numbers, the post-July recovery has run its course and Inglewood will likely revisit the $720s by summer. If gains accelerate back toward $5,000+ a month, the upcycle continues.
Similar Markets in CA
- Los Angeles — Inglewood’s parent metro, with broader inventory at varying price points.
- Long Beach — Coastal alternative in the same metro for buyers wanting harbor access.
- Anaheim — Orange County option for buyers willing to trade location for newer housing stock.
- Bakersfield — A growing California city with substantially lower prices for buyers priced out of LA.
- Riverside — Inland Empire pick for commuters seeking more home for the money.
Frequently Asked Questions
What is the average home price in Inglewood?
The average home price in Inglewood, CA is $736,829 as of February 2026. That figure reflects the Zillow Home Value Index across all 5 tracked ZIP codes, with individual neighborhoods ranging from $668,598 to $817,257.
Are home prices going up or down in Inglewood?
Prices are up 0.9% year over year. The market dipped through summer 2025, bottoming at $708,342 in July, then climbed back about 4% to reach the current $736,829.
Is it cheaper to rent or buy in Inglewood?
Renting is cheaper by roughly $2,000 a month. Average rent runs about $2,520, while a mortgage on the median home with 20% down at recent rates exceeds $4,500 before taxes and insurance.
What is the most affordable neighborhood in Inglewood?
ZIP 90301 is the cheapest at $668,598 — about $68,000 below the city average. ZIP 90302 is second at $681,252.
Methodology
Home values are based on the Zillow Home Value Index (ZHVI), a smoothed measure of typical home values in the 35th to 65th percentile range. Rent estimates use the Zillow Observed Rent Index (ZORI). Population figures come from the U.S. Census Bureau Population Estimates Program (2020-2024 vintage). All datasets are publicly available. Housing data updated 2026-02-28.