Glendale Home Prices: $1,149K, Up 0.4% — 9 ZIPs Analyzed (2026)
$1,148,663. That’s the typical home value in Glendale, CA as of February 2026. Prices are up 0.4% from a year ago — barely moving, but moving in the right direction for sellers after a soft summer.
Quick answer: The average home price in Glendale, CA is $1,148,663 as of February 2026, up 0.4% year over year according to Zillow.
Current Home Prices in Glendale
The Glendale market has flattened. After dipping below $1.13 million in late summer 2025, values have crept back up to $1.15 million. Year-over-year change sits at less than half a percent.
| Metric | Value |
|---|---|
| Median home value | $1,148,663 |
| Year-over-year change | +0.4% |
| Cheapest ZIP median | $761,348 (91204) |
| Priciest ZIP median | $1,696,440 (91207) |
| Spread between ZIPs | $935,092 |
| ZIP codes tracked | 9 |
| Data through | February 2026 |
The price spread tells the real story. The most expensive ZIP costs more than twice as much as the cheapest. A buyer with a $900,000 budget shops in entirely different neighborhoods than one with a $1.5 million budget — even though both are buying “in Glendale.”
For context, the Los Angeles–Long Beach–Anaheim metro is one of the most expensive housing markets in the country. Glendale sits firmly in the upper half of metro pricing, propped up by hillside neighborhoods and tight inventory in the older flatlands. The 0.4% annual gain is the kind of number that means the market is neither crashing nor booming. It’s holding.
You’re looking at a city where the typical home requires a household income north of $250,000 to comfortably finance at current rates. That income gate is doing most of the work in keeping demand subdued.
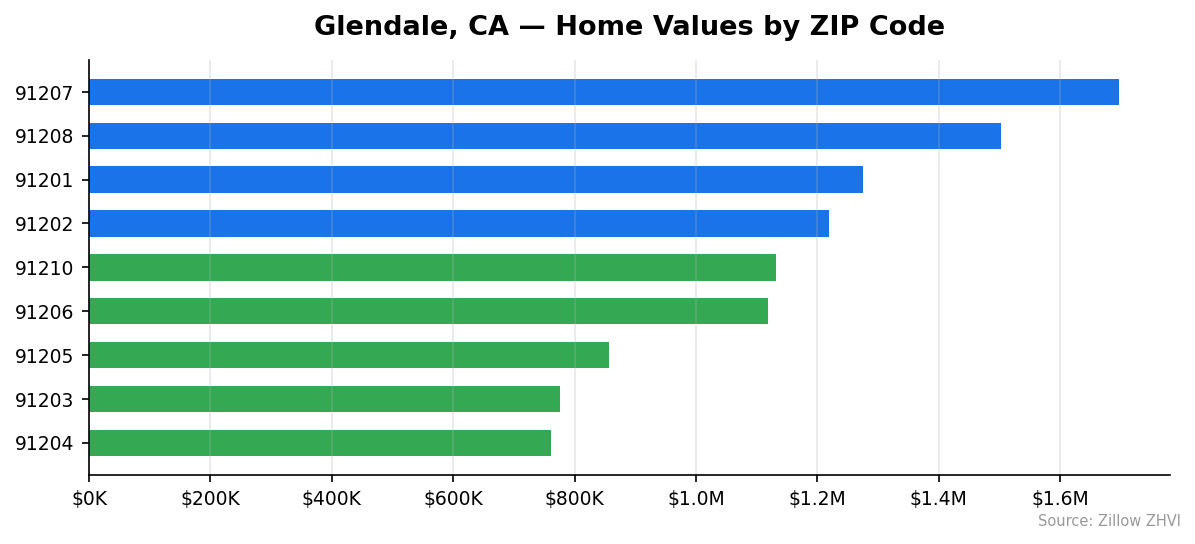
Glendale Home Prices by Neighborhood
Nine ZIP codes, three distinct price tiers.
| ZIP Code | Median Home Value | Avg. Monthly Rent |
|---|---|---|
| 91207 | $1,696,440 | $2,648 |
| 91208 | $1,502,474 | $3,291 |
| 91201 | $1,274,760 | $2,690 |
| 91202 | $1,219,587 | $2,859 |
| 91210 | $1,131,793 | Data not available |
| 91206 | $1,118,948 | $2,564 |
| 91205 | $856,081 | $2,232 |
| 91203 | $776,540 | $2,916 |
| 91204 | $761,348 | $2,621 |
Most Expensive
- 91207 — $1,696,440. The priciest ZIP in the city, sitting nearly 48% above the citywide median. Rents here are surprisingly moderate at $2,648, suggesting the buy side is pricing in something rentals don’t capture.
- 91208 — $1,502,474. The hillside premium shows up clearly: home values run 31% above the city median and rents are the highest in Glendale at $3,291.
- 91201 — $1,274,760. The third-priciest ZIP comes in 11% above the citywide median, with mid-pack rents near $2,690.
Most Affordable
- 91204 — $761,348. The cheapest ZIP, 34% below the city median. Rent of $2,621 makes it one of the few areas where the price-to-rent ratio looks something close to reasonable.
- 91203 — $776,540. Cheap to buy, expensive to rent. At $2,916/month rent against a $776,540 median, this is the highest-yielding ZIP for landlords in Glendale.
- 91205 — $856,081. The cheapest rents in Glendale at $2,232, paired with a sub-$900K median. The most affordable combination in the city.
Rent vs Buy in Glendale
Average rent across Glendale’s tracked ZIPs is roughly $2,728 a month.
A typical home at $1,148,663 with 20% down ($229,733) leaves a loan of about $918,930. At a 7% 30-year fixed rate, that’s roughly $6,113 a month in principal and interest. Add California property taxes (1.1% annually, about $1,053/month) and homeowners insurance ($200/month), and you’re at $7,366 before any HOA dues or maintenance.
| Cost | Rent | Buy (median home) |
|---|---|---|
| Monthly cost | $2,728 | $7,366 |
| Down payment | $0 | $229,733 |
| Annual cost | $32,736 | $88,392 |
Renting is cheaper by more than $4,600 a month at the median. The gap is wide enough that you’d need to be very confident about appreciation to justify buying purely on cash flow.
The math shifts in the cheapest ZIPs. At 91204’s $761,348 median, a 20% down mortgage runs roughly $4,900 a month all-in. Rent there averages $2,621, so the gap shrinks to about $2,300/month — still favoring renters, but less dramatically.
If you’re staying less than five years, the numbers favor renting almost everywhere in Glendale. Past five to seven years, the buy case strengthens, especially in cheaper ZIPs where the monthly delta is smaller.
Population Growth and Migration
Glendale is losing people. The city had 195,947 residents in 2020 and 187,823 in 2024 — a 4.1% drop in four years.
| Year | Population |
|---|---|
| 2020 | 195,947 |
| 2021 | 191,974 |
| 2022 | 189,699 |
| 2023 | 188,283 |
| 2024 | 187,823 |
The decline has slowed. The biggest drop came in 2021 (–2% in one year). By 2024, the year-over-year loss was just 0.2%.
How does Glendale stack up against other California cities?
| City | 2024 Population | 4-Year Growth |
|---|---|---|
| Bakersfield | 417,468 | +3.0% |
| Sacramento | 535,798 | +1.9% |
| San Diego | 1,404,452 | +1.4% |
| Fresno | 550,105 | +1.4% |
| Oakland | 443,554 | +0.6% |
| Glendale | 187,823 | –4.1% |
Glendale is the outlier. Every comparison city gained residents over the same period. Inland California cities — Bakersfield, Sacramento, Fresno — are absorbing households priced out of coastal metros.
Shrinking population usually pressures home prices downward over time. That Glendale prices are still up 0.4% YoY in spite of population loss tells you something about the underlying demand from buyers who already live in the LA region: they want to be in Glendale specifically, and they outnumber the supply of homes for sale.
Glendale Housing Market Trends
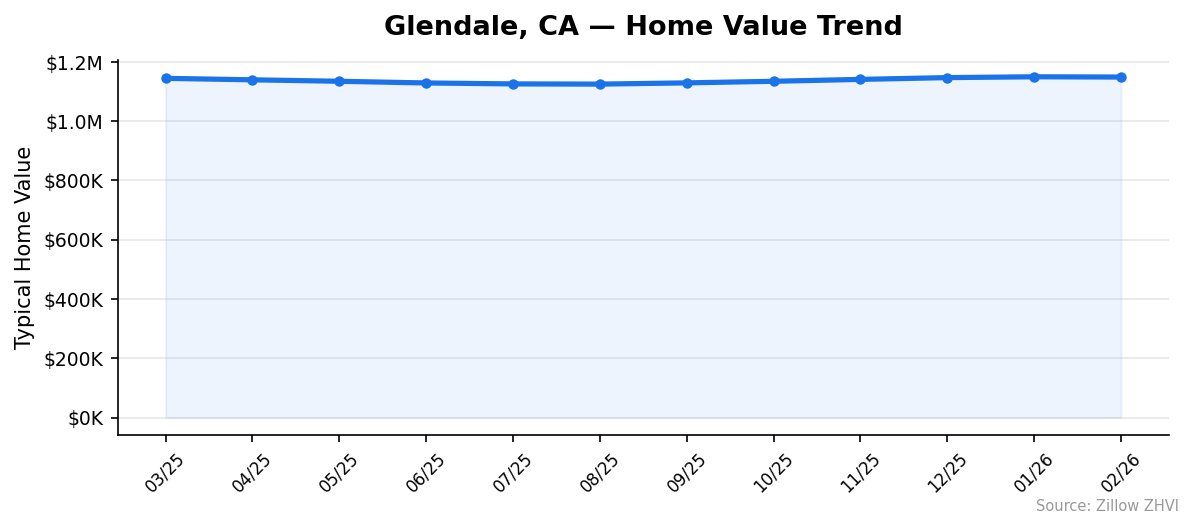
Twelve months of price action.
| Month | Median Value |
|---|---|
| March 2025 | $1,144,337 |
| April 2025 | $1,139,358 |
| May 2025 | $1,134,451 |
| June 2025 | $1,128,763 |
| July 2025 | $1,125,552 |
| August 2025 | $1,124,876 |
| September 2025 | $1,129,016 |
| October 2025 | $1,134,401 |
| November 2025 | $1,140,792 |
| December 2025 | $1,146,791 |
| January 2026 | $1,149,569 |
| February 2026 | $1,148,663 |
Prices fell for five straight months from March to August 2025, bottoming at $1,124,876. From there, six straight months of gains brought values back above March 2025 levels.
The February 2026 reading dipped slightly from January — about $900 lower. One month doesn’t make a trend, but the rebound has clearly slowed.
Total swing from peak (early 2025) to trough (August) was about 1.7%. The recovery erased that loss and added a small gain on top. This is a market that breathes, but not deeply.
Is Glendale a Good Place to Buy in 2026?
The data suggests a balanced market tilting slightly toward sellers.
Prices are up YoY, but only 0.4% — barely keeping up with the bottom of typical inflation. The August-to-February rebound was real but modest, about 2.1% over six months.
Population is shrinking, which long-term should soften prices. But Glendale’s homes don’t depend on population growth — they depend on regional demand from people already living in LA who want to move into the city. That demand has held.
For buyers: if you can afford it and plan to stay seven-plus years, the numbers can work, especially in the cheaper ZIPs (91203, 91204, 91205). The rent-vs-buy gap is too wide for short-term ownership to make sense.
For sellers: it’s not a screaming hot market, but the trend is your friend. Six months of consecutive gains and a mild February pullback suggests pricing slightly below comps to drive offers, rather than testing the ceiling.
Glendale Housing Market Outlook for 2026-2027
The 3-month trend (December through February) shows prices essentially flat — $1,146,791 to $1,148,663, with January peaking at $1,149,569. The momentum from the August lows has stalled.
If the current pace continues, expect Glendale prices to drift in the $1.14M–$1.16M range through the spring buying season. The pattern across the past two years shows summer softness followed by fall recovery, so a small dip into mid-2026 wouldn’t be a surprise.
The bigger variable is mortgage rates. Glendale’s price tier means buyers are highly sensitive to monthly payment math. A meaningful rate move in either direction will swing the next six months more than any local factor.
Population loss should keep a ceiling on price gains. The data doesn’t support a forecast of another double-digit run.
Similar Markets in CA
If Glendale’s $1.15M median pushes you out of budget, consider these California alternatives:
- Los Angeles — the broader LA market, with much wider price variation than Glendale alone.
- Long Beach — coastal LA County with generally lower prices than Glendale.
- Anaheim — Orange County alternative with comparable urban amenities.
- Bakersfield — the inland California option, where prices are a fraction of Glendale’s and population is actually growing.
- San Diego — different metro, similar premium-coastal price tier.
Frequently Asked Questions
What is the average home price in Glendale?
The median home value in Glendale, CA is $1,148,663 as of February 2026. That figure is the average across nine ZIP codes, ranging from $761,348 in 91204 to $1,696,440 in 91207.
Are home prices going up or down in Glendale?
Prices are up 0.4% year over year. The market bottomed near $1,124,876 in August 2025 and has climbed back roughly 2.1% over the six months since, though the gains stalled in February 2026.
Is it cheaper to rent or buy in Glendale?
Renting is significantly cheaper. The average rent of about $2,728 a month is roughly $4,600 less than the all-in monthly cost of buying the median home with 20% down at current rates. The gap narrows in cheaper ZIPs but doesn’t close.
What is the most affordable neighborhood in Glendale?
ZIP 91204 is the cheapest at a $761,348 median — about 34% below the citywide median. ZIP 91203 ($776,540) and 91205 ($856,081) round out the three most affordable areas in Glendale.
Methodology
Home values are based on the Zillow Home Value Index (ZHVI), a smoothed measure of typical home values in the 35th to 65th percentile range. Rent estimates use the Zillow Observed Rent Index (ZORI). Population figures come from the U.S. Census Bureau Population Estimates Program (2020-2024 vintage). All datasets are publicly available. Housing data updated 2026-02-28.