Mountain View Home Prices: $2,224K, Up 2.3% — 3 ZIPs Analyzed (2026)
$2,223,902. That’s what a typical home costs in Mountain View, CA as of February 2026. Prices are up 2.3% from a year ago, and the gap between the cheapest and priciest ZIPs is more than $1.25 million.
Quick answer: The average home price in Mountain View, CA is $2,223,902 as of February 2026, up 2.3% year over year according to Zillow.
Current Home Prices in Mountain View
The numbers tell a clear story. Mountain View sits in the San Jose-Sunnyvale-Santa Clara metro, and home values reflect that. The typical home runs more than seven times the U.S. median.
| Metric | Value |
|---|---|
| Median home value | $2,223,902 |
| Year-over-year change | +2.3% |
| Cheapest ZIP | $1,592,957 (94043) |
| Priciest ZIP | $2,846,288 (94040) |
| ZIP code spread | $1,253,331 |
| ZIPs analyzed | 3 |
| Data through | February 2026 |
The 2.3% annual gain looks modest, but the dollar amount is not. A 2.3% rise on a $2.17 million baseline adds roughly $50,000 to the price tag in twelve months. That’s more than the median U.S. household earns in a year.
The price spread between ZIPs matters. A buyer choosing 94043 pays $1.59 million for the typical home. A buyer in 94040 pays $2.85 million. Same city, different financial reality.
You won’t find single-family homes for under $1 million in Mountain View. The data shows the floor sits much higher.
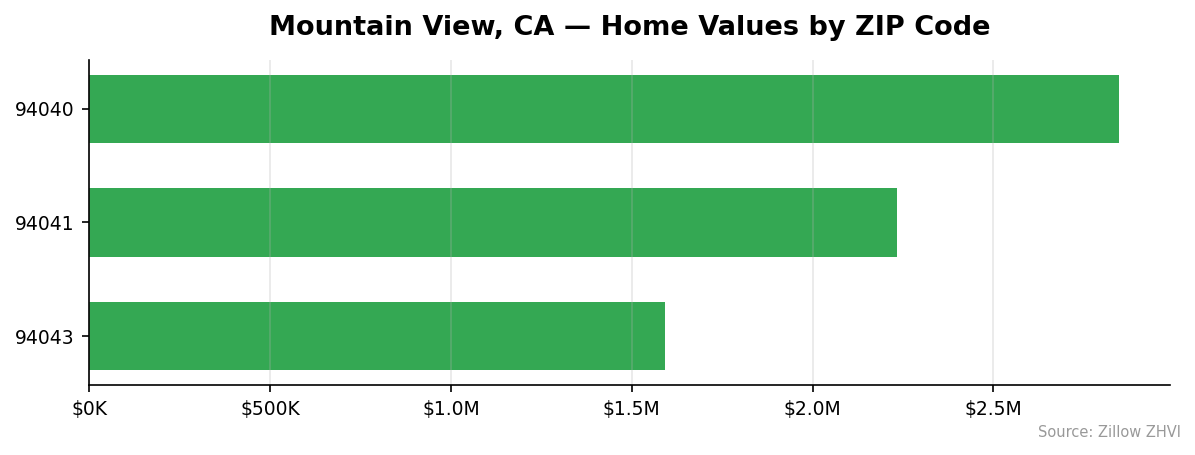
Mountain View Home Prices by Neighborhood
Three ZIP codes cover Mountain View. Each tells a different story.
| ZIP Code | Typical Home Value | Avg Monthly Rent |
|---|---|---|
| 94040 | $2,846,288 | $4,014 |
| 94041 | $2,232,463 | $4,185 |
| 94043 | $1,592,957 | $4,030 |
Most Expensive
94040 tops the list at $2,846,288, about 28% above the city median. This is the priciest part of Mountain View by a wide margin, yet rents here are actually the lowest of the three ZIPs at $4,014.
94041 sits in the middle at $2,232,463, almost exactly matching the city-wide median. Rents here lead the city at $4,185 per month.
94043 comes in third at $1,592,957, but “third” in a three-ZIP market means it’s also the most affordable.
Most Affordable
94043 at $1,592,957 is the only ZIP under $2 million. The price gap to 94040 is striking — buyers here pay roughly $1.25 million less for the typical home.
For context, 94043 still costs more than five times the U.S. median home value. Affordability in Mountain View is relative.
Rent prices barely vary across ZIPs. The spread between cheapest and priciest rent is just $171 per month, while purchase prices vary by more than $1.25 million.
Rent vs Buy in Mountain View
The math here is unusual. Average rent across the three Mountain View ZIPs lands at roughly $4,076 per month.
A mortgage on the $2,223,902 median home looks very different. With 20% down ($444,780) and a 30-year loan at 7%, the principal and interest alone runs about $11,830 per month. Add property tax (roughly $2,000+) and insurance, and you’re past $14,000 monthly.
That’s a $10,000 gap every month favoring the renter. Per year, the renter saves roughly $120,000 in housing costs alone — before counting the $444,780 sitting in cash instead of locked into a down payment.
| Cost | Monthly |
|---|---|
| Average rent (avg of 3 ZIPs) | ~$4,076 |
| Mortgage on $2.22M home (20% down, 7%) | ~$11,830 |
| Plus tax + insurance | ~$14,000+ |
The case for buying rests entirely on appreciation and the long-term tax treatment of mortgage interest. At a 2.3% annual gain, the median home added about $50,000 in value over the past year. That’s less than the rent-vs-buy gap.
If you’re a short-term resident, the math says rent. If you plan to stay a decade or more and can absorb the carrying cost, buying becomes a different conversation.
Population Growth and Migration
Mountain View is growing. The Census puts the 2024 population at 87,316, up 5.5% from 82,773 in 2020.
| Year | Population |
|---|---|
| 2020 | 82,773 |
| 2021 | 82,247 |
| 2022 | 82,339 |
| 2023 | 83,938 |
| 2024 | 87,316 |
The trend is interesting. Population dipped slightly in 2021, held flat through 2022, then jumped sharply in 2023 and 2024. The last year alone added more than 3,300 residents — the fastest yearly gain in the series.
Compare that to other California cities:
| City | 2024 Population | 4-Year Growth |
|---|---|---|
| Mountain View | 87,316 | +5.5% |
| Bakersfield | 417,468 | +3.0% |
| Sacramento | 535,798 | +1.9% |
| San Diego | 1,404,452 | +1.4% |
| Fresno | 550,105 | +1.4% |
| Oakland | 443,554 | +0.6% |
Mountain View is growing faster than any of the larger California cities in this comparison, despite home prices that dwarf all of them. Demand is real, and it’s pushing into a small geographic footprint with a fixed housing supply. That’s part of why prices stay where they are.
Mountain View Housing Market Trends
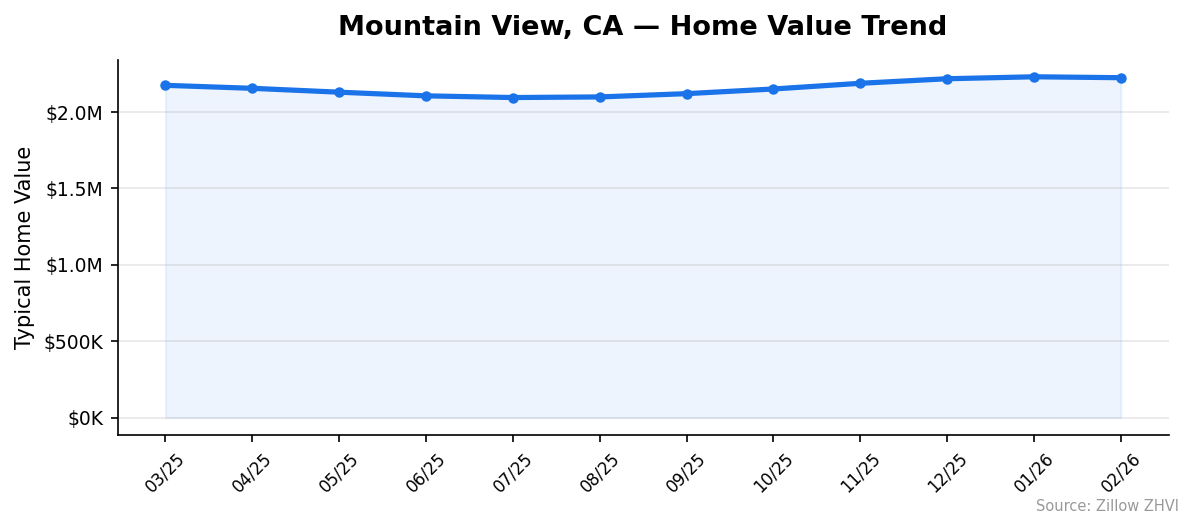
The 12-month trend reveals a market that bottomed out mid-2025 before recovering.
| Month | Median Value |
|---|---|
| February 2026 | $2,223,902 |
| January 2026 | $2,229,829 |
| December 2025 | $2,217,068 |
| November 2025 | $2,187,250 |
| October 2025 | $2,149,994 |
| September 2025 | $2,119,463 |
| August 2025 | $2,098,041 |
| July 2025 | $2,094,106 |
| June 2025 | $2,105,107 |
| May 2025 | $2,129,072 |
| April 2025 | $2,154,393 |
| March 2025 | $2,173,943 |
July 2025 was the bottom at $2,094,106. From there, values climbed for six straight months before pausing in February.
The recovery added roughly $130,000 to the typical home between July and January. That’s a 6.5% gain in six months, or about 13% annualized — far hotter than the official 2.3% YoY figure suggests.
February’s small dip from January (-$5,927, or -0.27%) is the first monthly decline since summer. One month doesn’t make a trend, but it’s worth watching.
Is Mountain View a Good Place to Buy in 2026?
The data points to a seller’s market, but with caveats.
Prices are recovering from a mid-2025 low. Inventory pressure shows up in the numbers — values climbed 6.5% in six months. That’s not a market where buyers have room to push back on price.
The population growth rate of 5.5% over four years exceeds every comparable California city in the data. People are arriving faster than housing supply can adjust.
But two things should temper buyer enthusiasm. February’s slight monthly decline could signal momentum is cooling. And the rent-vs-buy gap is enormous — the carrying cost of ownership runs roughly three times the rent on similar homes.
If you must own, ZIP 94043 offers the only entry point under $1.6 million. If flexibility matters more than equity, renting saves six figures per year that you can invest elsewhere.
This is a market for committed long-term buyers with cash. It’s a tough market for first-time buyers or anyone with a short time horizon.
Mountain View Housing Market Outlook for 2026-2027
The 3-month trend suggests prices have stalled. Values rose every month from July through January, then dipped 0.27% in February.
If the current pace continues, two scenarios look plausible. The recovery could resume, with values pushing past $2.25M by mid-2026. Or February’s pause could mark a peak, with values flattening or drifting lower through the summer.
The longer-view comparison is informative. Today’s $2.22M sits about 6% above July 2025’s bottom but only 2.3% above where prices were a year ago. That tells you the market has worked through one cycle and is testing for the next direction.
Population growth of 5.5% over four years provides demand support. New supply in Mountain View remains constrained. Both factors lean bullish for prices, but neither overrides what mortgage rates and the broader Bay Area economy do over the next 12 months.
Similar Markets in CA
California buyers comparing markets have wildly different price points to choose from:
- Los Angeles — California’s largest city offers more variety than Mountain View but at scale.
- San Diego — Coastal alternative with its own population growth story.
- Long Beach — A more affordable LA-area option for buyers priced out of the Bay Area.
- Fresno — Central Valley option for buyers who want California without coastal pricing.
- Bakersfield — The most affordable major city in this state-level comparison.
Frequently Asked Questions
What is the average home price in Mountain View?
The typical home in Mountain View costs $2,223,902 as of February 2026. That figure reflects the Zillow Home Value Index across the three ZIP codes that cover the city: 94040, 94041, and 94043.
Are home prices going up or down in Mountain View?
Prices are up 2.3% year over year. Values bottomed at $2,094,106 in July 2025 and climbed through January 2026 before a small 0.27% dip in February. The recent six-month trend shows much faster appreciation than the YoY number alone suggests.
Is it cheaper to rent or buy in Mountain View?
Renting is far cheaper on a monthly basis. Average rent across Mountain View ZIPs runs about $4,076, while owning the median home costs roughly $14,000 monthly once you include mortgage, taxes, and insurance. Buying makes sense only for long-term owners betting on appreciation.
What is the most affordable neighborhood in Mountain View?
ZIP 94043 is the most affordable at $1,592,957, about 28% below the city median. Rent in 94043 runs $4,030 per month, nearly identical to the priciest ZIP — so rental affordability is uniform even though purchase prices vary by more than $1.25 million.
Methodology
Home values are based on the Zillow Home Value Index (ZHVI), a smoothed measure of typical home values in the 35th to 65th percentile range. Rent estimates use the Zillow Observed Rent Index (ZORI). Population figures come from the U.S. Census Bureau Population Estimates Program (2020-2024 vintage). All datasets are publicly available. Housing data updated 2026-02-28.