Redwood City Home Prices: $1,669K, Flat — 3 ZIPs Analyzed (2026)
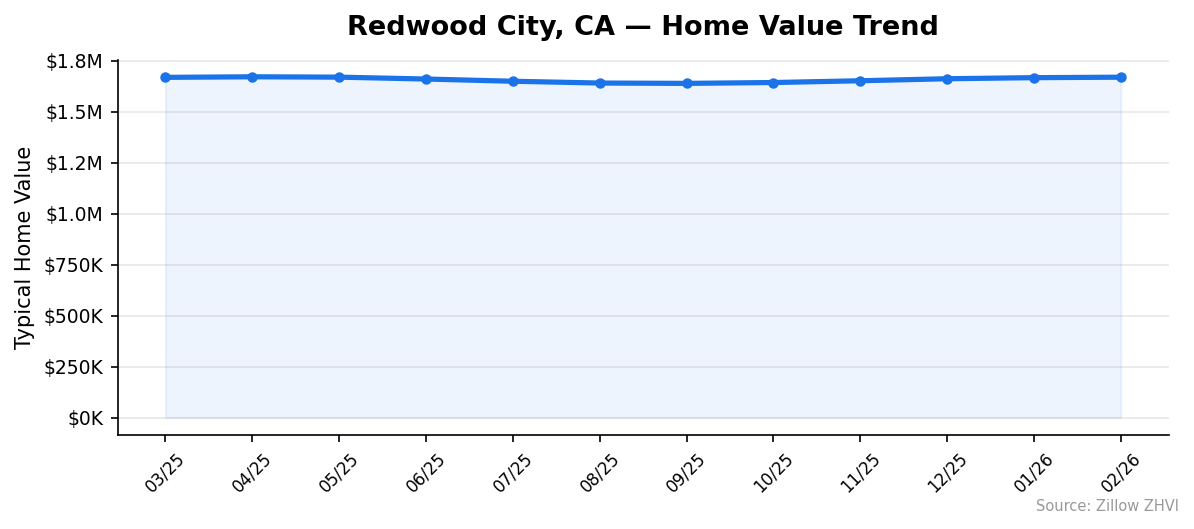
$1,668,714. That’s what a typical home costs in Redwood City as of February 2026. The market has gone nowhere over the past 12 months — prices are flat at 0.0% year over year.
Quick answer: The average home price in Redwood City, CA is $1,668,714 as of February 2026, flat year over year according to Zillow.
Current Home Prices in Redwood City
The Redwood City market is sitting still. After a soft spring and summer in 2025, prices bottomed out around $1.64 million in September, then drifted back up. February’s reading lands within $300 of last May’s number.
| Metric | Value |
|---|---|
| Median home value | $1,668,714 |
| Year-over-year change | 0.0% |
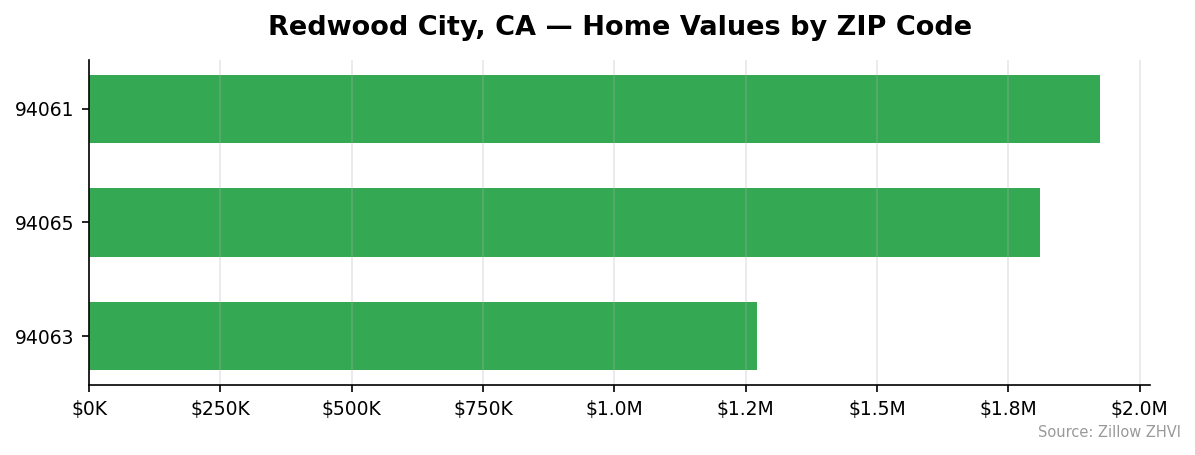
| Cheapest ZIP code | $1,271,698 (94063) |
| Most expensive ZIP code | $1,923,589 (94061) |
| Spread between ZIPs | $651,891 |
| ZIP codes tracked | 3 |
| Data through | February 2026 |
The flat YoY number hides some movement. From the April 2025 peak of $1,670,677, prices fell about 2% by September, then recovered. You’re looking at a market where the typical buyer needs roughly $334,000 cash for a 20% down payment — and that’s at the city average, not the high end.
The $651,891 gap between the cheapest and priciest ZIP is wider than the entire median home price in many U.S. cities. Where you buy in Redwood City matters more than when.
Redwood City Home Prices by Neighborhood
Three ZIP codes cover Redwood City, and they tell three different stories.
| ZIP Code | Median Price | Monthly Rent | vs City Avg |
|---|---|---|---|
| 94061 | $1,923,589 | $3,502 | +15.3% |
| 94063 | $1,271,698 | $3,714 | -23.8% |
| 94065 | $1,810,854 | $4,225 | +8.5% |
Most Expensive
- 94061 — $1,923,589. The priciest ZIP in the city, sitting more than $250,000 above the city average. Rent here is the lowest of the three at $3,502, suggesting the area skews toward owner-occupied housing.
- 94065 — $1,810,854. Second on price but first on rent at $4,225 per month. The rent-to-price ratio here is the highest of any Redwood City ZIP.
- 94063 — $1,271,698. Even the cheapest ZIP sits well above $1.2 million.
Most Affordable
- 94063 — $1,271,698. The only ZIP under $1.5 million, and it’s the only realistic entry point for buyers who can’t stretch to seven figures plus.
- 94065 — $1,810,854. Mid-tier on price but the highest rents in the city — landlords are pricing for waterfront-adjacent demand.
- 94061 — $1,923,589. The premium tier, with the lowest monthly rent of the three.
Rent vs Buy in Redwood City
Renting wins by a wide margin in 2026.
| Scenario | Monthly Cost |
|---|---|
| Average rent (across 3 ZIPs) | $3,814 |
| Mortgage on $1,668,714 home (20% down, 7% rate, P&I only) | $8,880 |
| Cheapest ZIP rent (94061) | $3,502 |
| Priciest ZIP rent (94065) | $4,225 |
The math: a 20% down payment on the median Redwood City home costs $333,743. The remaining $1,334,971 mortgage at a 7% rate runs about $8,880 per month in principal and interest. Add property taxes (Santa Clara County effective rates push another $1,400+ monthly) and insurance, and the all-in number clears $10,500.
That’s roughly 2.7x the average rent.
For renters, the gap between the cheapest and priciest ZIP is only $723 per month. For buyers, the same comparison spans more than $651,000 in price. Renting smooths out the geography in a way owning never will.
The break-even case for buying requires significant appreciation, and the past 12 months delivered exactly zero.
Population Growth and Migration
Redwood City has lost residents.
| Year | Population |
|---|---|
| 2020 | 83,875 |
| 2021 | 81,633 |
| 2022 | 81,720 |
| 2023 | 81,965 |
| 2024 | 82,982 |
The city dropped from 83,875 in 2020 to a low of 81,633 in 2021, then started recovering. The 2024 figure is still 893 residents below the 2020 baseline — a 1.1% decline over four years.
Compare that to other California cities:
| City | 2024 Population | 4-Year Growth |
|---|---|---|
| Bakersfield | 417,468 | +3.0% |
| Sacramento | 535,798 | +1.9% |
| San Diego | 1,404,452 | +1.4% |
| Fresno | 550,105 | +1.4% |
| Oakland | 443,554 | +0.6% |
| Redwood City | 82,982 | -1.1% |
Redwood City is the only city on this list that lost population. For a market with $1.67 million median prices, that’s a relevant signal. Demand isn’t being driven by an influx of new residents — it’s being held up by limited supply, high incomes from nearby tech employers, and the sheer cost of the broader Bay Area.
Redwood City Housing Market Trends
The 12-month picture shows a market that gave up gains, then took them back.
| Month | Avg Price | Min ZIP | Max ZIP |
|---|---|---|---|
| Feb 2026 | $1,668,714 | $1,271,698 | $1,923,589 |
| Jan 2026 | $1,666,384 | $1,269,371 | $1,917,862 |
| Dec 2025 | $1,661,126 | $1,263,553 | $1,909,396 |
| Nov 2025 | $1,651,171 | $1,254,801 | $1,896,413 |
| Oct 2025 | $1,642,582 | $1,248,399 | $1,883,831 |
| Sep 2025 | $1,638,378 | $1,247,695 | $1,876,621 |
| Aug 2025 | $1,640,038 | $1,252,441 | $1,874,904 |
| Jul 2025 | $1,648,830 | $1,263,383 | $1,881,845 |
| Jun 2025 | $1,659,706 | $1,273,888 | $1,891,207 |
| May 2025 | $1,668,949 | $1,280,377 | $1,899,005 |
| Apr 2025 | $1,670,677 | $1,280,089 | $1,898,575 |
| Mar 2025 | $1,667,894 | $1,278,365 | $1,893,906 |
April 2025 marked the local peak at $1,670,677. By September, prices had fallen about $32,000 to $1,638,378 — a 1.9% drop in five months. Since then, the market has clawed back nearly all of those losses. Five consecutive months of gains brought February 2026 within $2,000 of the April 2025 high.
The pattern looks like a classic seasonal dip rather than a directional shift.
Is Redwood City a Good Place to Buy in 2026?
It depends what you’re optimizing for.
The data points to a stable but not appreciating market. Zero YoY change means buyers from a year ago broke even on price — and lost ground to inflation. The recent five-month upswing is real but modest, adding about $30,000 to the median home value.
Rent vs buy math heavily favors renting. With a 2.7x gap between mortgage payments and rent, buyers need either substantial appreciation, a long holding period, or both to come out ahead. Population is shrinking, not growing, which weakens the pure-demand case for price growth.
This is a market for buyers who plan to stay 7-10+ years, who value stability of housing costs, or who are buying for reasons beyond pure investment math — schools, location to work, a particular ZIP. Speculative buyers should look elsewhere.
The seller’s case is weaker than it was in April 2025. Listing now means accepting that prices haven’t moved in a year.
Redwood City Housing Market Outlook for 2026-2027
The 3-month trend points up. Prices rose from $1,651,171 in November to $1,668,714 in February — a gain of about 1.1% over three months, or roughly 4.3% annualized if the pace continues.
If the current pace continues, Redwood City should clear its April 2025 peak within the next 1-2 months and post modest year-over-year gains by the summer reading. The seasonal pattern from 2025 suggests a possible softening in late summer, when prices fell from $1.67M in May to $1.64M by September.
A repeat of that seasonal dip would limit full-year 2026 appreciation. Without it, the market is on track for low single-digit gains.
The main risk to this outlook: continued population decline. Redwood City has shed residents in three of the past four years. If that pattern accelerates, supply pressure could outweigh the recent momentum.
Similar Markets in CA
- Los Angeles — much larger metro, generally lower per-square-foot prices outside premium ZIPs.
- San Diego — a coastal alternative with growing population and a different price tier.
- Anaheim — Orange County market that often comes in below Bay Area pricing.
- Long Beach — Southern California option for buyers priced out of the peninsula.
- Riverside — significantly cheaper inland market for buyers willing to leave the coast.
Frequently Asked Questions
What is the average home price in Redwood City?
The average home price in Redwood City, CA is $1,668,714 as of February 2026. That figure is the average across the three ZIP codes that make up the city, ranging from $1,271,698 in 94063 to $1,923,589 in 94061.
Are home prices going up or down in Redwood City?
Prices are flat year over year at 0.0% change. However, the most recent three months show an upward trend — prices rose about 1.1% from November to February, suggesting the market is recovering from a fall 2025 dip.
Is it cheaper to rent or buy in Redwood City?
Renting is dramatically cheaper. The average monthly rent across Redwood City ZIPs is about $3,814, while the principal-and-interest payment on the median home with 20% down at a 7% rate exceeds $8,800. Adding property tax and insurance pushes the buy cost above $10,500 per month.
What is the most affordable neighborhood in Redwood City?
ZIP code 94063 is the most affordable at $1,271,698 — about $397,000 below the city average. It’s the only Redwood City ZIP under $1.5 million.
Methodology
Home values are based on the Zillow Home Value Index (ZHVI), a smoothed measure of typical home values in the 35th to 65th percentile range. Rent estimates use the Zillow Observed Rent Index (ZORI). Population figures come from the U.S. Census Bureau Population Estimates Program (2020-2024 vintage). All datasets are publicly available. Housing data updated 2026-02-28.