Covina Home Prices: $811K, Up 1% — 3 ZIPs Analyzed (2026)
$811K. That’s what a typical Covina home costs as of February 2026. Prices climbed 1% over the past year — slow growth in a metro where five-figure annual swings used to be normal.
You’ll notice the gap between ZIP codes is wider than the gap between months. The cheapest corner of Covina sits more than $115,000 below the priciest one.
Quick answer: The average home price in Covina, CA is $810,985 as of February 2026, up 1.0% year over year according to Zillow.
Current Home Prices in Covina
The number to remember is $810,985. That’s the typical home value across Covina’s three ZIP codes, weighted by Zillow’s index methodology.
| Metric | Value |
|---|---|
| Median home value | $810,985 |
| Year-over-year change | +1.0% |
| Lowest ZIP value | $757,959 |
| Highest ZIP value | $874,697 |
| ZIP-to-ZIP spread | $116,738 |
| Data month | February 2026 |
| ZIPs analyzed | 3 |
What does 1% growth actually mean in dollar terms? About $8,000 added to a typical home over twelve months. That’s less than one mortgage payment.
For context: the Los Angeles-Long Beach-Anaheim metro saw mixed price action in 2025. Covina’s slight rise puts it in the modest-gainer camp — neither booming nor cratering. The price floor at $757,959 still requires a six-figure down payment if you’re aiming for 20% down.
The spread between ZIPs tells you something important. Even within one small San Gabriel Valley city, where you buy matters more than when you buy. A buyer choosing between 91722 and 91724 is making a $116,000 decision based on the address alone.
Inventory data isn’t included here, so we won’t speculate on how long homes sit. But the price stability — minor month-over-month changes, no double-digit moves — points to a market that has settled into a steady rhythm.
Covina Home Prices by Neighborhood
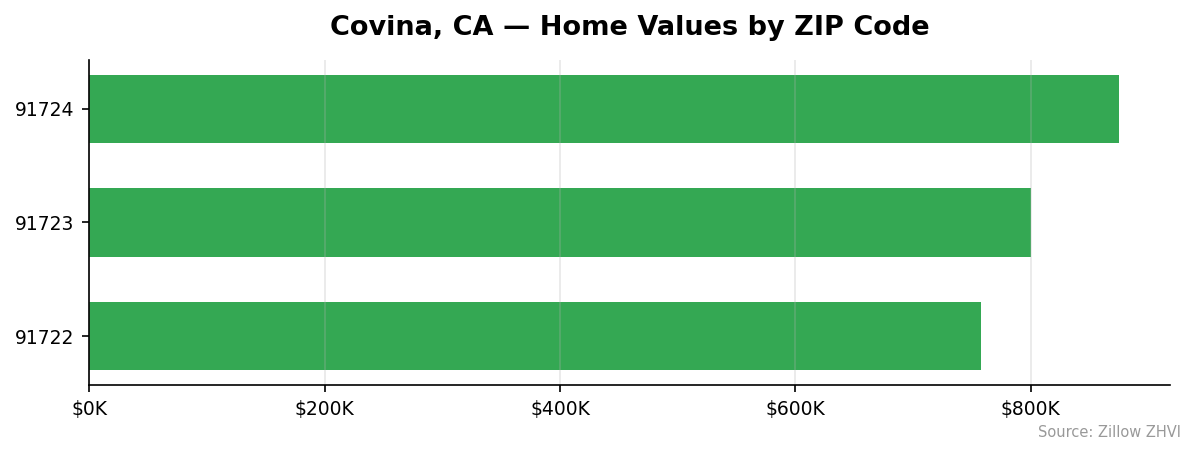
Three ZIP codes cover Covina. Here’s how they stack up.
| ZIP Code | Median Home Value | Median Rent (ZORI) | vs City Avg |
|---|---|---|---|
| 91722 | $757,959 | $2,713 | -6.5% |
| 91723 | $800,301 | $1,967 | -1.3% |
| 91724 | $874,697 | $2,756 | +7.9% |
Most Expensive
91724 tops the list at $874,697. That’s nearly $64,000 above the city average and reflects the eastern stretch of Covina where rent also runs at the high end ($2,756/month).
91723 comes in second at $800,301. Despite being only slightly below the city average for sale prices, it has the lowest rent in town at $1,967 — a notable disconnect that may reflect different housing stock between owned and rented units.
91722 is the cheapest at $757,959, but rent there ($2,713) runs higher than 91723. Renters and owners are paying for different things in this part of the city.
Most Affordable
There are only three ZIPs, so the same list applies. 91722 is the entry point at $757,959 — about 7% under the citywide median. 91723 is the middle option at $800,301 with the lowest rent. 91724 is the premium choice and not really competing on affordability.
If you want the cheapest entry into Covina ownership, 91722 is the obvious answer. If you want the cheapest place to rent while you save, 91723 wins by a wide margin.
Rent vs Buy in Covina
The rent numbers across Covina average roughly $2,479 per month. The buy numbers — well, they tell a different story.
A $810,985 home with 20% down ($162,197) leaves a $648,788 loan. At a 6.5% 30-year fixed rate, principal and interest run about $4,100 per month. Add California property tax (roughly 1.1% of home value, or $743/month) and homeowner’s insurance (~$150). You’re at roughly $4,990 per month.
| Cost Type | Monthly |
|---|---|
| Average rent (ZORI) | $2,479 |
| Mortgage P&I (20% down, 6.5%) | $4,100 |
| Property tax (1.1%) | $743 |
| Insurance estimate | $150 |
| Total ownership | ~$4,993 |
| Rent vs buy gap | ~$2,514 |
Renting saves around $2,500 per month in pure cash flow. That’s $30,000 a year staying in your pocket.
But that math ignores equity buildup, mortgage interest deduction, and price appreciation. Even at 1% appreciation per year, owners gain about $8,000 in home value annually — not enough to close the gap on its own. Buyers in Covina are making a long-hold bet, not a short-term arbitrage play.
The cheapest ZIP for renters is 91723 at $1,967/month. If you can find a unit there, your rent-vs-buy gap widens by another $500 per month.
Population Growth and Migration
Covina’s population is shrinking. The city had 51,168 residents in 2020 and 49,245 in 2024 — a loss of 1,923 people, or 3.8% over four years.
| Year | Population |
|---|---|
| 2020 | 51,168 |
| 2021 | 50,196 |
| 2022 | 49,469 |
| 2023 | 49,177 |
| 2024 | 49,245 |
The decline has slowed. Between 2023 and 2024, the city actually added 68 residents — the first uptick since 2020. Whether that’s the start of a recovery or a one-year blip won’t be clear until the next vintage.
How does that compare to other California cities?
| City | 2024 Population | 4-Year Growth |
|---|---|---|
| Bakersfield | 417,468 | +3.0% |
| Sacramento | 535,798 | +1.9% |
| San Diego | 1,404,452 | +1.4% |
| Fresno | 550,105 | +1.4% |
| Oakland | 443,554 | +0.6% |
| Covina | 49,245 | -3.8% |
Every comparison city grew. Covina lost ground.
For housing demand, this matters. A shrinking population usually means softer price pressure over time. The fact that Covina prices still rose 1% despite population losses suggests outside buyers — likely from higher-priced LA areas — are picking up the slack from departing residents.
Covina Housing Market Trends
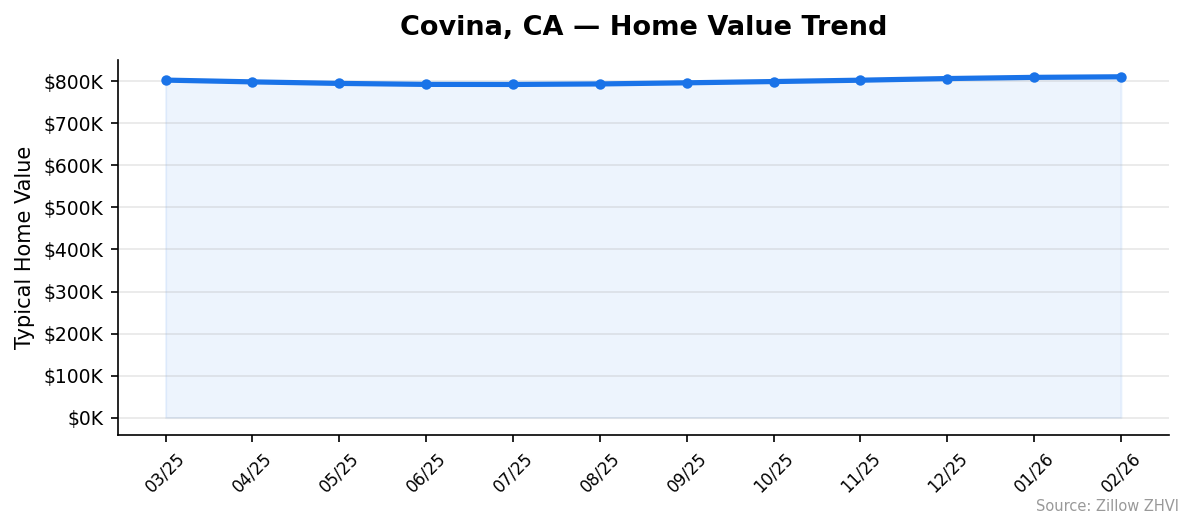
Twelve months of price data show a market that bottomed in mid-2025 and has climbed steadily since.
| Month | Median Value |
|---|---|
| March 2025 | $803,096 |
| April 2025 | $798,873 |
| May 2025 | $795,230 |
| June 2025 | $792,909 |
| July 2025 | $792,737 |
| August 2025 | $793,989 |
| September 2025 | $796,662 |
| October 2025 | $799,660 |
| November 2025 | $802,866 |
| December 2025 | $806,779 |
| January 2026 | $809,615 |
| February 2026 | $810,985 |
The low point was July 2025 at $792,737. From there, prices have risen for seven straight months. February’s $810,985 is up $18,248 from the summer trough — a 2.3% gain in roughly seven months.
The recent monthly pace has been smaller than the rebound mid-stretch. November to December gained $3,913. December to January gained $2,836. January to February gained $1,370. Momentum is positive but decelerating.
Year over year, the change is just 1%. The story isn’t growth so much as recovery — Covina spent the first half of 2025 giving back gains, then earned them back in the second half.
Is Covina a Good Place to Buy in 2026?
The data points in mixed directions.
In favor of buying: prices are rising, not falling. Year-over-year change is positive. The market has shown seven straight months of gains. If you wait, you may pay more.
Against buying: population is shrinking, which usually softens demand long-term. The rent-vs-buy gap of roughly $2,500/month is hard to close on appreciation alone at current 1% YoY pace. Mortgage costs at 6.5% rates make total monthly outlay roughly twice the cost of renting.
This isn’t a strong seller’s market or a clear buyer’s market — it’s a slow market. Prices are inching up, but not at a pace that pressures buyers to act fast. If you have a stable job, plan to stay 7+ years, and prefer 91722 or 91723 to spread risk, the math can work. If you’re flexible on timing and not married to ownership, renting in 91723 at $1,967/month is the cheapest housing decision available in Covina right now.
Covina Housing Market Outlook for 2026-2027
The 3-month trend shows monthly gains shrinking — $3,913, then $2,836, then $1,370. If the current pace continues, Covina could end 2026 with prices in the low-to-mid $820,000s.
The 12-month trajectory points slightly upward, but with declining momentum. Combined with a shrinking population base, that argues for a flat-to-slightly-positive 2026 rather than another leg up.
A few things would change this outlook. Lower mortgage rates would pull more buyers into the market and likely push prices higher. A continued population decline accelerating beyond 2024 levels would do the opposite. The data we have doesn’t predict either outcome — it just shows where Covina sits today.
If you’re a buyer, the decelerating monthly gains buy you time. If you’re a seller, the seven-month uptrend suggests waiting another quarter or two could pay off — but only if momentum doesn’t stall further.
Similar Markets in CA
If Covina’s $811K median feels steep, here are nearby alternatives in California:
- Bakersfield — A growing city (+3% population) typically priced well below LA County levels.
- Fresno — Central Valley pricing, much lower than San Gabriel Valley.
- Riverside — A common landing spot for LA-area buyers priced out of closer-in markets.
- Fontana — Inland Empire alternative within commuting range of Covina.
- Long Beach — Coastal LA County, priced higher than Covina but with different amenities.
Frequently Asked Questions
What is the average home price in Covina?
The average home price in Covina, CA is $810,985 as of February 2026. That figure reflects the Zillow Home Value Index averaged across the city’s three ZIP codes (91722, 91723, 91724).
Are home prices going up or down in Covina?
Prices are up 1.0% year over year. The market bottomed in July 2025 at $792,737 and has gained for seven consecutive months since, though the monthly pace has slowed in early 2026.
Is it cheaper to rent or buy in Covina?
Renting is cheaper month to month. Average rent runs about $2,479, while a typical mortgage payment with 20% down totals roughly $4,990 including taxes and insurance — a gap of about $2,500 per month in favor of renting.
What is the most affordable neighborhood in Covina?
ZIP 91722 is the most affordable at $757,959, about 6.5% below the citywide median. ZIP 91723 is the cheapest for renters at $1,967 per month, well below the city’s other two ZIPs.
Methodology
Home values are based on the Zillow Home Value Index (ZHVI), a smoothed measure of typical home values in the 35th to 65th percentile range. Rent estimates use the Zillow Observed Rent Index (ZORI). Population figures come from the U.S. Census Bureau Population Estimates Program (2020-2024 vintage). All datasets are publicly available. Housing data updated 2026-02-28.