Newport Beach Home Prices: $4047K, Up 6.7% — 6 ZIPs Analyzed (2026)
$4,047,094. That is what a typical Newport Beach home is worth as of February 2026. Prices climbed 6.7% over the past year, even as the city itself lost residents.
Quick answer: The average home price in Newport Beach, CA is $4,047,094 as of February 2026, up 6.7% year over year according to Zillow.
Current Home Prices in Newport Beach
The typical Newport Beach home crossed the $4 million line for the first time this winter. The 6.7% annual gain puts the market well ahead of the Los Angeles–Long Beach–Anaheim metro and most of coastal California.
| Metric | Value |
|---|---|
| Median home value | $4,047,094 |
| Year-over-year change | +6.7% |
| Lowest ZIP value | $2,630,034 |
| Highest ZIP value | $5,494,177 |
| ZIP codes tracked | 6 |
| Latest data | February 2026 |
The spread tells you something important. The cheapest ZIP and the priciest one differ by $2.86 million. That is a wider absolute gap than most American cities have for their entire price range. In Newport Beach, you can buy a home for $2.6 million or pay more than twice that, depending on which side of the harbor you land on.
The price floor itself is high. Even the most affordable ZIP code in Newport Beach sits more than five times above the national median. There is no entry-level pocket here. Every neighborhood the Zillow index covers has a typical value above $2.6 million.
What pushed the market up 6.7% in a year of high mortgage rates? The data does not answer the why. It does show that the gain was not a one-month anomaly. Values rose every single month from June 2025 through February 2026.
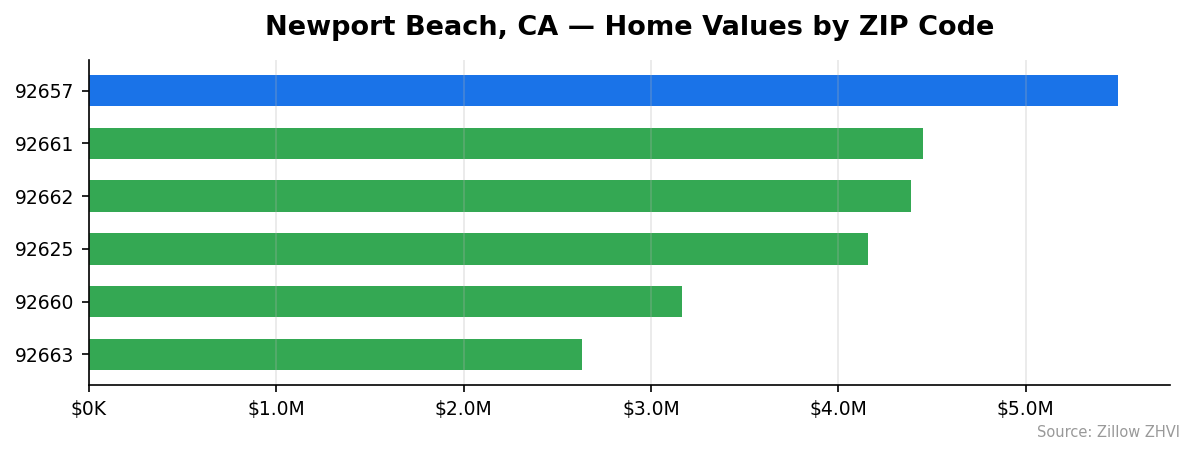
Newport Beach Home Prices by Neighborhood
Six ZIP codes make up the Newport Beach market in this dataset. Here is how they compare.
| ZIP Code | Typical Home Value | Avg Monthly Rent | vs City Median |
|---|---|---|---|
| 92657 | $5,494,177 | $6,148 | +35.8% |
| 92661 | $4,450,162 | $9,143 | +10.0% |
| 92662 | $4,385,298 | $6,899 | +8.4% |
| 92625 | $4,157,663 | $9,151 | +2.7% |
| 92660 | $3,165,231 | $4,128 | -21.8% |
| 92663 | $2,630,034 | $2,710 | -35.0% |
Most Expensive
92657 tops the list at $5,494,177, roughly 36% above the Newport Beach median, with rents averaging $6,148 a month. 92661 sits at $4,450,162 with the highest rents in the city — $9,143 per month — pointing to a market where short-term and luxury rental demand is strong. 92662 rounds out the top three at $4,385,298, where typical rent of $6,899 still trails what owners pay to carry a mortgage.
Most Affordable
92663 is the cheapest ZIP at $2,630,034, with rents at $2,710 per month — by far the most reasonable rent figure in the city. 92660 is next at $3,165,231 with rents of $4,128. 92625 is the third-cheapest by home value at $4,157,663, but its $9,151 average rent is the highest in the dataset, a clear gap between buyer and renter pricing.
Rent vs Buy in Newport Beach
Renting wins on monthly cash flow, and it is not close.
The cheapest rent in the city — $2,710 in 92663 — is what you would pay for a typical home there. Compare that to owning. With 20% down on the city-wide median of $4,047,094, the loan would be $3.24 million. At today’s rates, principal and interest alone runs north of $20,000 per month. Add property tax (California’s 1% base plus local assessments), insurance, and maintenance, and total monthly carrying costs push toward $26,000.
The cheapest neighborhood, 92663, illustrates the math at the low end:
| Cost item | 92663 |
|---|---|
| Typical home value | $2,630,034 |
| 20% down payment | $526,007 |
| Median monthly rent | $2,710 |
A renter in 92663 pays $32,520 per year for housing. A buyer in the same ZIP would put down more than half a million dollars and then pay roughly six to seven times that monthly rent figure to own. The breakeven horizon is long.
This is a market where ownership is a wealth-storage decision, not a payment-vs-payment decision. Rents in 92625 and 92661 — both above $9,000 — also signal that even the rental market here is positioned for high-income tenants.
Population Growth and Migration
Newport Beach is losing people. The city had 85,163 residents in 2020 and 82,970 in 2024, a decline of 2.6% over four years.
| Year | Population |
|---|---|
| 2020 | 85,163 |
| 2021 | 84,343 |
| 2022 | 83,648 |
| 2023 | 83,091 |
| 2024 | 82,970 |
Every year shows a drop. The pace slowed in 2024, but the direction has not reversed. That puts Newport Beach in a different category from most California cities its size.
| City | 2024 Population | 4-Year Growth |
|---|---|---|
| San Diego | 1,404,452 | +1.4% |
| Fresno | 550,105 | +1.4% |
| Sacramento | 535,798 | +1.9% |
| Oakland | 443,554 | +0.6% |
| Bakersfield | 417,468 | +3.0% |
| Newport Beach | 82,970 | -2.6% |
You would expect a city losing residents to also lose home value. Newport Beach is doing the opposite. Prices climbed 6.7% in the same year the population shrank. The most likely read: housing demand here is driven by buyers who do not need to live in town, or by households replacing larger ones in the same homes. Either way, supply is tight enough that fewer residents has not translated into softer prices.
Newport Beach Housing Market Trends
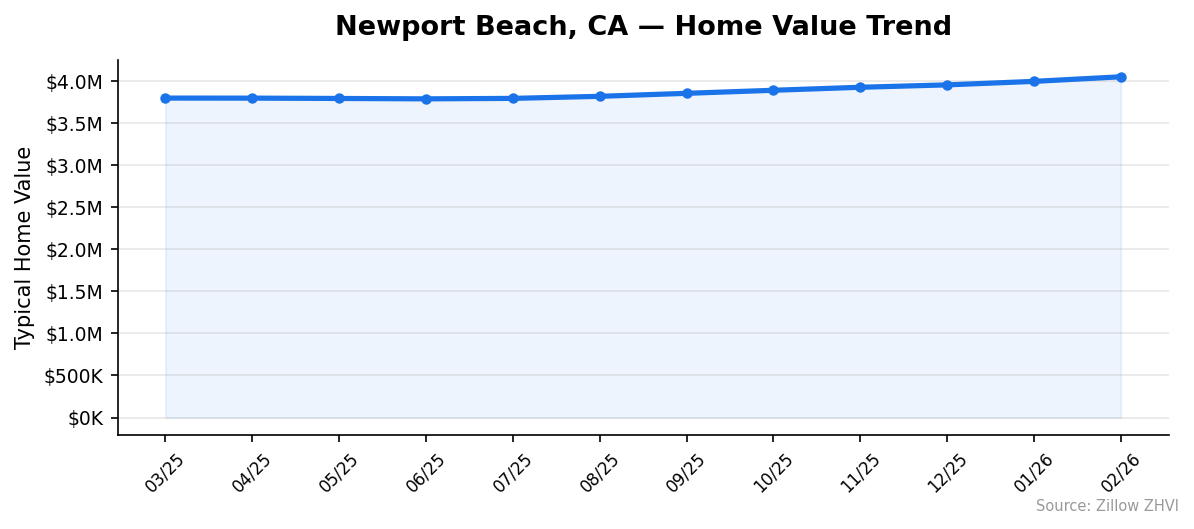
Twelve months of monthly data show a market that hesitated last spring, then turned upward.
| Month | Average Value |
|---|---|
| February 2026 | $4,047,094 |
| January 2026 | $3,992,643 |
| December 2025 | $3,950,985 |
| November 2025 | $3,922,681 |
| October 2025 | $3,886,870 |
| September 2025 | $3,850,738 |
| August 2025 | $3,815,035 |
| July 2025 | $3,790,643 |
| June 2025 | $3,785,080 |
| May 2025 | $3,789,789 |
| April 2025 | $3,793,512 |
| March 2025 | $3,794,196 |
The bottom of the year was June at $3,785,080. From there, prices rose every single month — eight straight monthly gains adding $262,014 to the typical home, or roughly +6.9% in eight months. That is a faster pace than the 6.7% annual figure, which suggests momentum has been picking up, not slowing.
The early-year flat patch (March through June 2025 all clustered near $3.79 million) is gone. February’s $54,451 monthly jump is the largest single-month gain in the dataset.
Is Newport Beach a Good Place to Buy in 2026?
The data points to a seller’s market.
Prices are rising, with no monthly setback in nine months. Inventory is implicitly tight — values do not climb 6.9% in eight months in a balanced market. And the price floor is the highest in coastal Orange County: even the cheapest ZIP starts at $2.63 million.
For a buyer, the math is brutal. You need real cash. A 20% down payment at the city median is more than $800,000. Monthly carrying costs at the median exceed $20,000. The cheapest ZIP, 92663, still requires more than half a million down.
For a seller, the picture is different. You are sitting on an asset that gained $262,014 in eight months and is showing momentum, not exhaustion. If you bought before 2024, your equity position is strong.
There is a case for waiting on the buy side. The population is shrinking. If demand cools to match the resident base, the price trend could pause. But nothing in the most recent monthly data shows that pause arriving yet.
Newport Beach Housing Market Outlook for 2026-2027
The 3-month trend points up. From December to February, the typical home gained $96,109 — about $32,000 per month on average. February alone added $54,451.
If the current pace continues, the city median will cross $4.1 million by spring. That is not a forecast of a specific number — it is what the trajectory implies. The risk to that path is straightforward: rates, the broader California economy, and whether population loss eventually catches up with demand.
The 12-month chart shows no monthly decline since June 2025. A reversal would require a clear break from that pattern, and there is no sign of one in the most recent reading. Watch the next two monthly updates. If gains shrink below $20,000 per month, the rally is decelerating. If they keep running above $40,000, the seller’s market intensifies.
Similar Markets in CA
- Los Angeles — the regional anchor, with a different mix of price tiers than Newport Beach’s all-luxury market.
- Long Beach — coastal alternative with broader price points than Newport Beach offers.
- Anaheim — same Orange County metro, more accessible price floor than Newport.
- San Diego — coastal Southern California option with a growing population, unlike Newport Beach.
- Riverside — inland alternative for buyers priced out of the Newport Beach market.
Frequently Asked Questions
What is the average home price in Newport Beach?
The typical home in Newport Beach was worth $4,047,094 in February 2026 according to the Zillow Home Value Index. The figure averages six ZIP codes ranging from $2,630,034 in 92663 to $5,494,177 in 92657.
Are home prices going up or down in Newport Beach?
Up. Prices rose 6.7% year over year and have gained ground every single month since June 2025. February 2026 alone added $54,451 to the typical home value.
Is it cheaper to rent or buy in Newport Beach?
Renting. The average rent across the six ZIP codes ranges from $2,710 to $9,151 per month, while owning the city-median home would require more than $800,000 down and roughly $20,000+ per month in mortgage payments alone before taxes, insurance, and maintenance.
What is the most affordable neighborhood in Newport Beach?
ZIP 92663 at $2,630,034 — about 35% below the city median. It also has the lowest typical rent in the city at $2,710 per month, making it the most accessible pocket of Newport Beach for both buyers and renters.
Methodology
Home values are based on the Zillow Home Value Index (ZHVI), a smoothed measure of typical home values in the 35th to 65th percentile range. Rent estimates use the Zillow Observed Rent Index (ZORI). Population figures come from the U.S. Census Bureau Population Estimates Program (2020-2024 vintage). All datasets are publicly available. Housing data updated 2026-02-28.